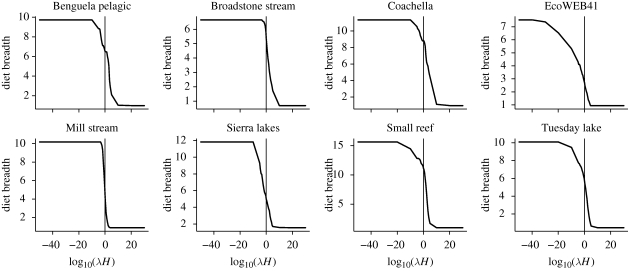
Figure 5.
Sensitivity of diet breadth in eight food webs to changes in the product of attack rates and handling times (ratio handling time function). The x-axis is an arbitrary multiplier applied to aT0 to create variation in λH. The value of λH equivalent to 20°C is shown at x value of zero (vertical dotted line). The gradient of the solid line where it crosses the dotted line is the sensitivity of diet breadth to temperature change at 20°C. These gradients match the relative sensitivities shown in figure 3d.

