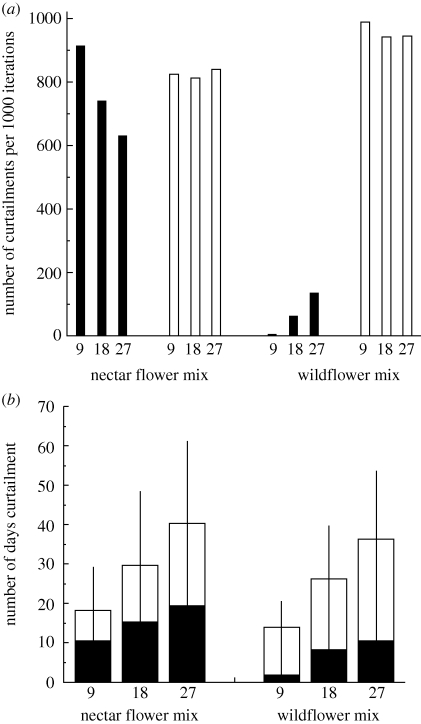
Figure 4.
Curtailment in bumble-bee resource availability. (a) The number of times curtailment occurs in 1000 iterations of each simulation (9, 18 and 27 days), at the start and end of the flowering period for the two types of field margins; (b) curtailment duration for the two margin mixes at the start and the end of the flowering period. The error bars show the 95% confident intervals for the total curtailment duration. White bars, end curtailment; black bars, start curtailment.

