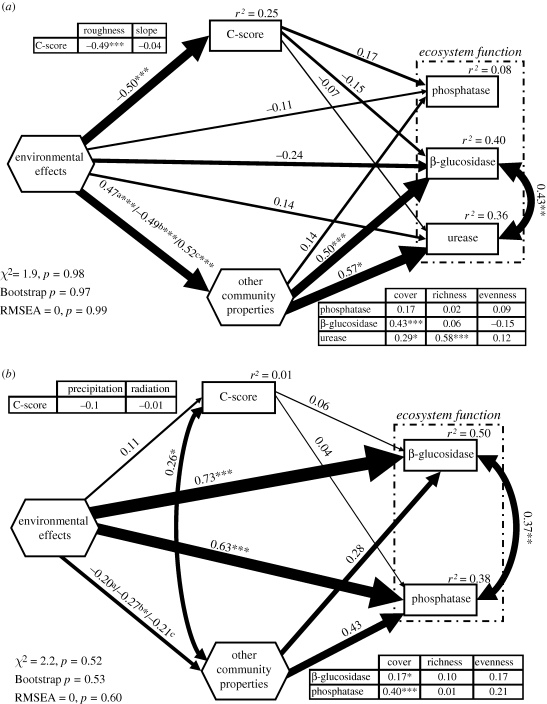
Figure 2.
Final SEM models for the datasets obtained from Studies (a) 1 and (b) 2. Numbers adjacent to arrows are path coefficients, analogous to regression weights and indicative of the effect size of the relationship. Width of arrows is proportional to the strength of path coefficients. As in other linear models, r2 signifies proportion of variance explained and appears above every response variable in the model. Goodness-of-fit statistics for each model are shown in the lower left corner. There are some differences between the a priori model and the final model structures owing to removal of paths with coefficients close to zero; these modifications make only trivial changes in the models. Inset tables reflect the individual path coefficients from variables that compose the composite variables, and C-score or function variables. a, b and c denote path coefficients from environmental effects composite to species richness, total cover and species evenness, respectively. Significance levels are as follows: *p < 0.05, **p < 0.01 and ***p < 0.001.

