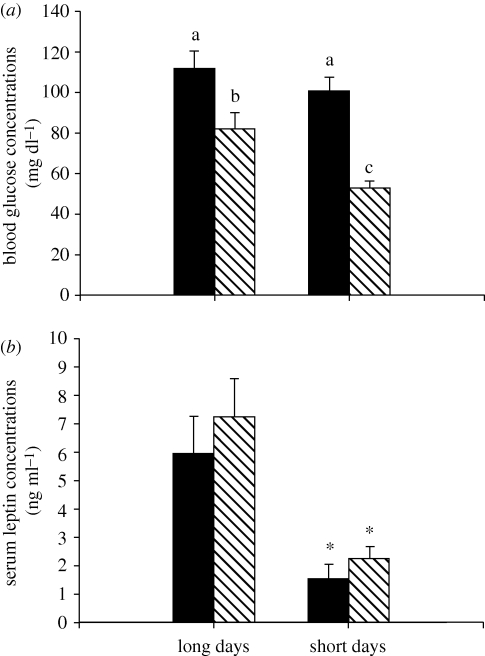
Figure 3.
Mean (±s.e.m.) blood glucose (a) and serum leptin concentrations (b) in Siberian hamsters housed in either long or short days and administered exogenous insulin (striped bar) or vehicle (filled bar) control. Significant differences in blood glucose are indicated by different letters, whereas significant differences in serum leptin concentration are indicated by an asterisk (*) if p < 0.05.

