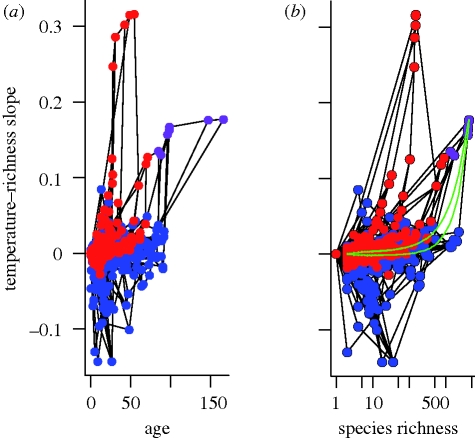
Figure 2.
The slope of the temperature–richness relationship for clades as a function of (a) clade age and (b) species richness. Bat nodes are depicted in red, nodes without bats are depicted in blue and their ancestral nodes are depicted in purple. Ancestry is depicted with lines. In (b), the green lines indicate the central 95 per cent of 1000 tip-swapped randomizations. The figures essentially show the mammal phylogenetic tree on its side with the ancestral clade depicted at the right (as the oldest clade with the most species) and the branches depicted on a y-axis (temperature–richness slope). The lineage lines link clades on the left that are a subset of the clades on the right.

