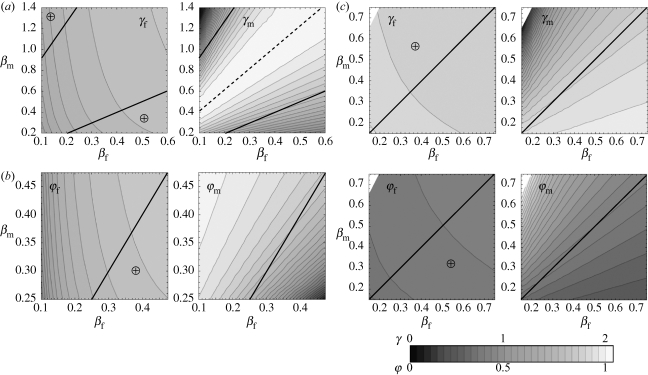
Figure 3.
ESS variations with sex-specific infection rates βf (horizontal axes) and βm (vertical axes). Lighter shades represent higher values of the trait at the ESS. Circled crosses (⊕) indicate regions (delimited by solid lines) where females evolve higher immunocompetence than males. (a) Model (i), variations in female (left panel) and male (right panel) recovery rates at the ESS; the dashed line shows where the prevalence of infection in males at the ESS is 50%; note the different scales on the horizontal and vertical axes. (b) Model (ii), variations in female (left panel) and male (right panel) relative fecundity during infection at the ESS. (c) Model (iii), variations in female (left panels) and male (right panels) traits at the ESS: recovery rate in the upper row and relative fecundity during infection in the lower row.

