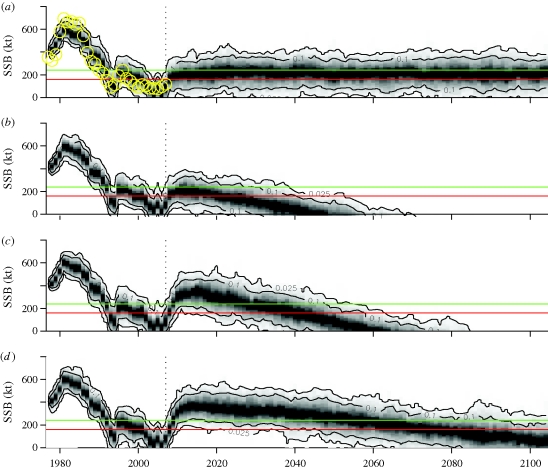
Figure 3.
Future climate and management scenarios and a 95% probability distribution of Baltic cod SSB. (a) A ‘control scenario’ where climate (SST and salinity) and fishing mortalities (F) fluctuate at mean 1974–2004 levels. Hindcasted simulations from 1977 to 2007 (i.e. based on the observed climate and F levels for these years) are compared with observed SSB (yellow circles) to validate the predictive accuracy of the model. (b) A predicted increase in mean SST by 3.5°C and decrease in mean salinity by 4.8 psu combined with mean F levels. (c) As in (b) but with F reduced to the previously recommended precautionary reference levels (Fpa). (d) Exploitation at Fpa but with a predicted decrease in salinity by only 0.8 psu. Solid horizontal lines mark the recommended ecological levels of Baltic cod, the precautionary stock level, Bpa (green) and limiting stock level, Blim (red). (Note that the use of these biomass reference points is currently being re-evaluated). Black contour lines show the 90 and 95% prediction intervals within which the cod stock dynamics of each replicated run fluctuates.

