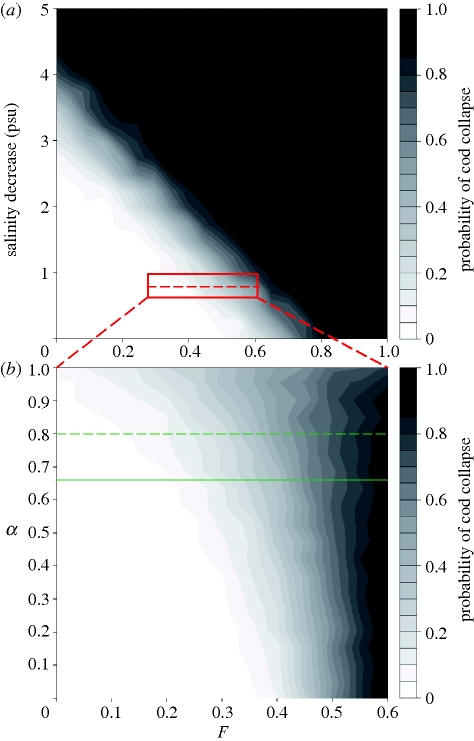
Figure 4.
Probability of cod stock falling below ecologically safe levels (Blim) given future changes in climate and fishing mortalities. (a) Probabilities are calculated from simulations of mean decrease in salinity from 0 to 5 psu and F levels from 0 to 1. In (b) the additional effect of increasing environmental autocorrelation in future climate time series (i.e. alpha from 0 to 1) is investigated by studying the change in the slope of the ‘probability landscape’ at a projected salinity decline of 0.8 psu specifically (see red rectangle in (a)). Simulations were conducted over a range of fishing mortalities (F from 0 to 0.6) while the projected increase in SST remained fixed at 3.5°C. The green solid line marks the actual alpha in the salinity time series, while the dashed line aims to represent a correction for possible underestimations of forecasted global climate model autocorrelations, i.e. here set to a maximum of 20 per cent. White areas indicate low probabilities of cod biomass being below ecologically safe limits (Blim), while black areas demonstrate high probabilities.

