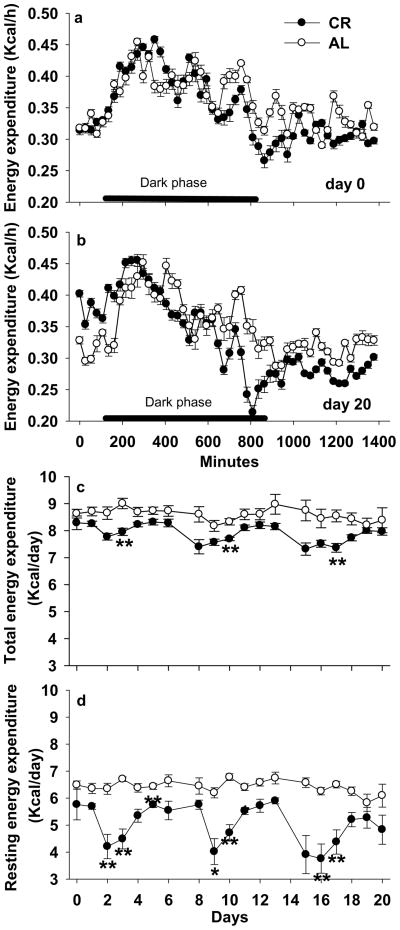
Figure 3.
Effects of 3-week mild calorie restriction (5%) on (a) hourly energy expenditure at day 0; (b) hourly energy expenditure at day 20; (C) daily total energy expenditure; and (d) daily resting energy expenditure. Values are means ± SE (n=7 for ad libitum and n=8 for calorie restriction group). *P<0.05; **P<0.01 compared with ad libitum mice at the same time.

