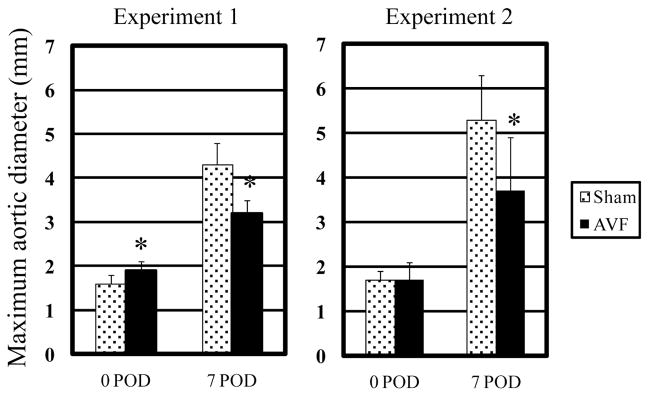
Figure 4.
Maximum aortic diameter at day 0, 7, or 14 days after PPE infusion (POD indicated postoperative day) as a function of normal flow (sham) or flow loading (AVF) applied either before (experiment 1) or after (experiment 2) PPE infusion (*p<0.05 against normal flow group). Reprinted from Nakahashi et al., 2002, Arterioscler. Thromb. Vasc. Biol. 22, 2017–2022 with permission.

