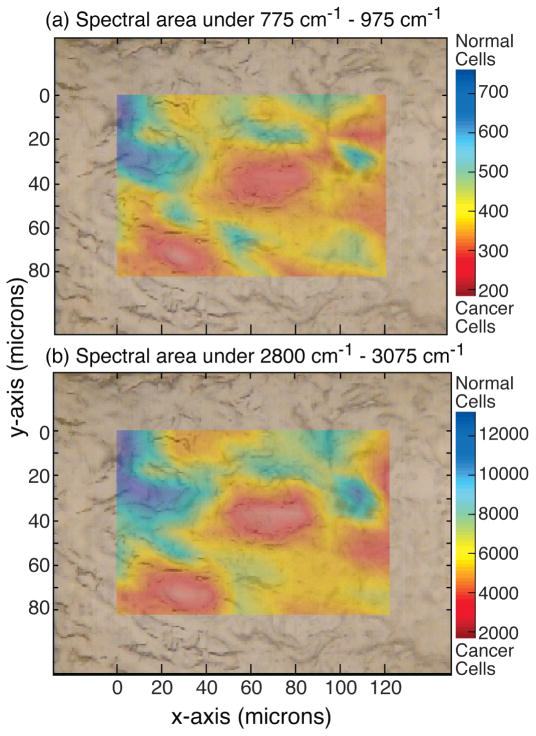
Fig. 7.
(a) Raman chemical map of invasive cervical cancer tissue sample K0225A generated by integrating the spectral area between the 775 and 975 cm−1 regions indicating location of cancer cells (in red) and normal cells (in blue). (b) Raman chemical map of the same tissue generated by spectral area under the CH region validates the map generated in plot (a). All spectra measured with 785 nm laser, 30 mW, and 10 s integration time.

