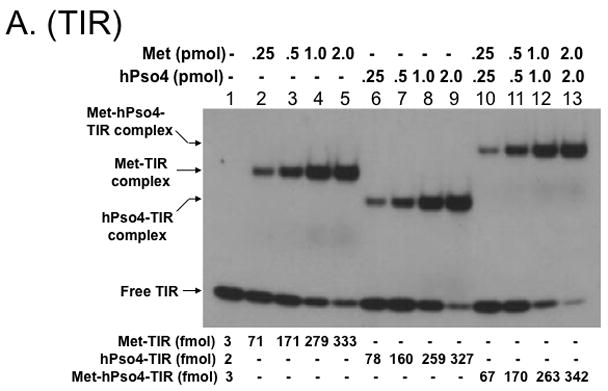
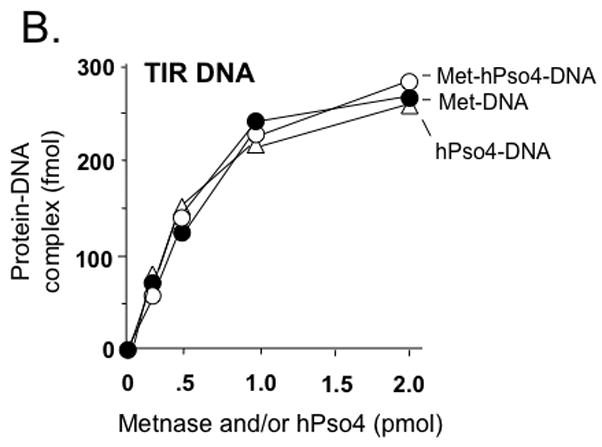
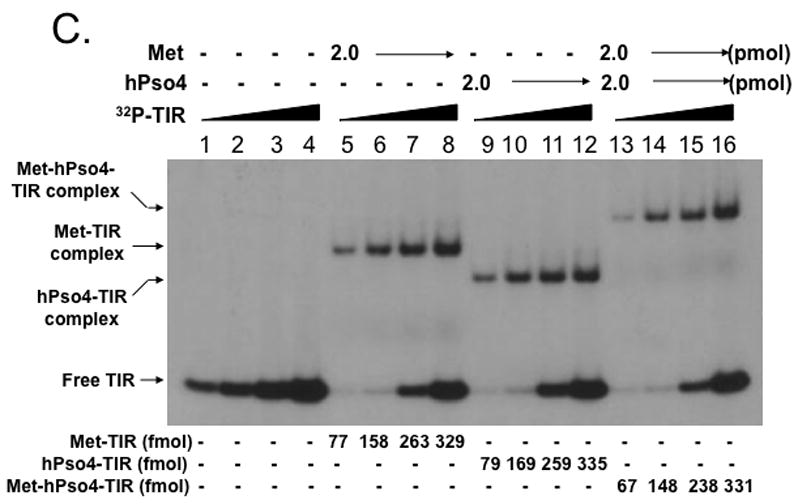
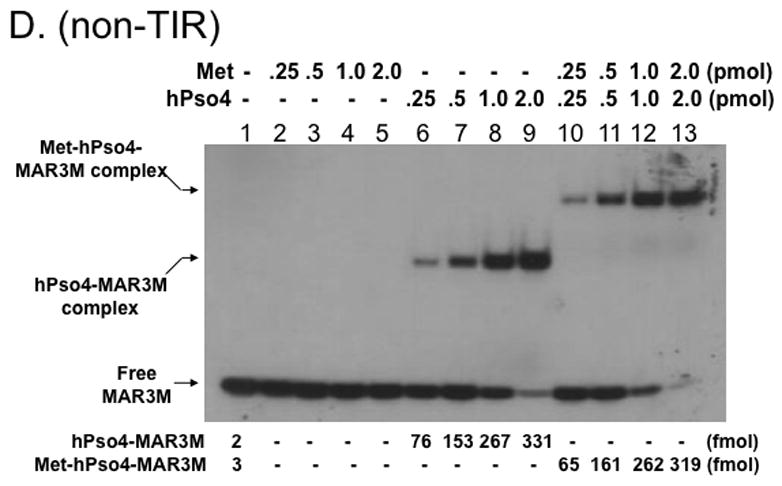
Figure 4. Metnase forms a 1:1 stoichiometric complex with hPso4 on dsDNA.


A. Stoichiometric analysis of Metnase and/or hPso4 interaction with TIR DNA. Reaction mixtures (20 ul) containing indicated amounts of Metnase and/or hPso4 were incubated with 5′-32P-labeled DNA (400 fmol) for 15 min prior to 5% native PAGE analysis in the presence of 1X TBE. For quantification, individual bands were excised from dried gel and measured for radioactivity. B. Amounts of the Metnase-TIR (closed circle), hPso4-TIR (open triangle), and Metnase-hPso4-TIR complexes (open circle) from Fig. 4A were plotted. C. Relative TIR-binding activity of Metnase, hPso4, and the Metnase-hPso4 complex. Metnase, hPso4, or the Metnase-hPso4 complex (2 pmol each) was incubated with varying amounts (0.1, 0.2, 0.4, and 0.8 pmol) of 32P-TIR DNA at 25°C for 15 min prior to 5% native PAGE analysis. Individual protein-DNA complexes (marked on the left side of the figure) were quantified using the NIH image program (version 1.62). D. Stoichiometric analysis of Metnase and/or hPso4 interaction with non-TIR DNA (MAR3M). Reaction mixtures (20 ul) were the same as those described in Figure 4A, except for the use of 5′-32P-labeled non-TIR DNA (MAR3M, 400 fmol). Individual protein-DNA complexes were marked on the left side.
