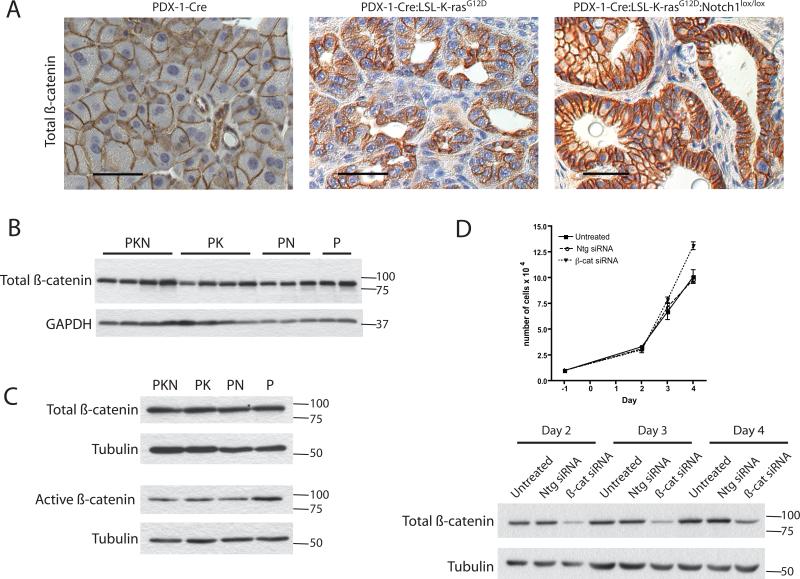
Figure 4. Expression and activation state of β-catenin in pancreata from cohorts.
Expression and localization of total β-catenin (A) (Scale bar = 40μm) by immunohistochemical staining in pancreata from PDX-1-Cre, PDX-1-Cre:LSL-K-rasG12D, and PDX-1-Cre:LSL-K-rasG12D:Notch1lox/lox mice. (B) Expression levels of total β-catenin in whole pancreatic lysates by western blot analyses. Four independent samples are shown for PDX-1-Cre:LSL-K-rasG12D:Notch1lox/lox (PKN) and PDX-1-Cre:LSL-K-rasG12D (PK) cells, 3 independent samples for PDX-1-Cre:Notch1lox/lox (PN) cells and 2 independent samples forPDX-1-Cre (P) cells. (GAPDH = loading control). (C) Western blot analysis of total and activated β-catenin expression in PDCs. (Tubulin = loading control). Results shown are representative of two independent PDC lines tested for each genotype. (D) Proliferation of PDX-1-Cre:LSL-KrasG12D:Notch1lox/lox PDCs untreated, treated with Non-targeting siRNA pool (Ntg siRNA), or β-catenin siRNA pool (β-cat siRNA). Values shown are the mean of 3 independent samples. Western blot analysis of β-catenin knockdown in PDCs treated with siRNA on days 2, 3, and 4. (Tubulin =loading control).

