

Abstract
Objective
Recent literature suggests that the scalloped structure of the dentino-enamel junction (DEJ) is critical for DEJ stability. Aim of our study was to see if there are differences in scallop size and shape with tooth type.
Methods
Enamel of extracted permanent human teeth was demineralised using EDTA. After fixation and dehydration the scallops of the DEJ were investigated in a scanning electron microscope. Scallop area and shape (circularity) were measured for molars, premolars, canines and incisors.
Results
Scallop area showed main effects for tooth type and specimen, while, due to high variability in third molars, there was also an interaction effect (repeated measures two-way ANOVA, p < 0.05). Differences between tooth types were statistically significant, suggesting that posterior teeth showed larger scallops compared to anterior teeth. Differences in shape (circularity) were not statistically significant.
Conclusion
Our results suggest that teeth which are subject to higher masticatory loads (posterior teeth) show larger and more pronounced scallops. These findings might be of interest for improving other interfaces joining dissimilar materials.
Keywords: dentino-enamel junction, interface, tooth structure, biomimetic model, teeth, scanning electron microscopy
1. Introduction
The dentino-enamel junction (DEJ) joins two very dissimilar materials (i.e., the hard and brittle enamel and the tougher dentine) which should, theoretically, be prone to mechanical failure. The fact that it is not makes the DEJ and its unique microstructure a potential biomimetic model for other interfaces. While cracks seem to be stopped in the mantle dentine rather than at the DEJ, delamination during loading through mastication does not seem to occur.1 In the literature, this has been explained by the presence of collagen fibrils, which bridge the DEJ and thus make its structure comparable to that of a fibre-reinforced structure.2-5 In addition to this fibre reinforcement, the DEJ scallops seem to have an impact on the mechanical properties: The structure of the DEJ can be described as scalloped with its convexities directed toward the dentine and concavities toward the enamel;6 each scallop houses microscallops as well as collagen fibrils.3,7 This structure was thought to enhance bonding between the calcified tissues.3,8,9 Modelling experiments confirmed this view and showed the importance of the scalloped structure for mechanical performance of the interface, which might be even more important than bridging by collagen fibrils.10
Qualitative differences in scallop morphology with tooth type have been reported.7 Hence, the aim of this research was to further investigate and quantitatively describe the variation in scallop morphology (i.e., size and shape) with tooth type (molars, premolars, canines and incisors).
2. Materials and methods
2.1 Demineralising of enamel
Human teeth from subjects requiring extractions as part of dental treatment were collected following a protocol approved by the UCSF Committee on Human Research. Teeth were stored in Hank’s Balanced Salt Solution (HBSS) at 4°C after extraction and sterilized using gamma radiation.11,12 Roots were removed, and crowns were sectioned buccal-lingually using a Buehler Diamond Saw (Buehler, Lake Bluff, IL, USA) under running water. Enamel was partially removed using a dental hand piece and then demineralised with 0.5 M EDTA (pH 7.4) until the DEJ was revealed (10 to 20 days). When treated with EDTA, enamel gets “chalky” in appearance and the disappearance of this feature indicates that the enamel is gone.
2.2 Scanning electron microscopy
Teeth were immersed in 3% glutaraldehyde in 0.1 M sodium cacodylate buffer at pH 7.4 for 12 h at 4°C, and then washed with 20 mL of 0.2 M sodium cacodylate buffer at pH 7.4 for 1 h with three changes of solution. Specimens were rinsed with deionised water for 1 min, dehydrated in ascending grades of ethanol and dried in hexamethyldisilazane (HMDS) for 10 min, which was shown to minimise shrinkage and preserve the collagen network.13 Specimens were sputter-coated with 200 nm Au/Pd in a Hummer VII sputtering system (Anatech Ltd, Alexandria, VA, USA). Specimens were then examined in an SEM (scanning electron microscope, ISI ABT SX-40A SEM, Topcon Instruments, Pleasanton, CA, USA) using secondary electron mode at 15 kV. For each specimen three SEM images were collected at 250-fold magnification.
2.3 Image analysis and statistics
Images were converted to binary black and white images using Scion Image software (Scion Corporation, Frederick, MD, USA), and scallop area and perimeter were determined using the Scion Image analysis tool. Only clearly defined scallops were included in the measurements. Per image, between 20 and 52 scallops were evaluated, depending on the number of scallops present (i.e. depending on the scallop size). For each image, results were randomised and 20 values (for each scallop area and corresponding perimeter) per image were used for analysis. For each tooth, results were obtained from 3 images (i.e. a total of 60 values per tooth), and for each tooth type (molars, premolars, canines and incisors) three independent specimens were used in the statistical evaluation (Table 1), i.e. 12 specimens in total.
Table 1.
Tooth specimens used for statistical evaluation of scallop size: Specimen code, tooth number (universal system of notation), tooth type and mean values for scallop area in μm2, circularity and standard deviation (SD, in brackets).
| Tooth Type |
Specimen | Tooth# | Scallop area in μm2 (SD) |
Circularity (SD) |
|---|---|---|---|---|
| Molars | M.1 | 17 | 637 (251) | 0.666 (0.107) |
| M.2 | 32 | 1597 (704) | 0.661 (0.095) | |
| M.3 | 32 | 1700 (982) | 0.646 (0.080) | |
|
| ||||
| Premolars | P.1 | 13 | 1198 (583) | 0.684 (0.087) |
| P.2 | 13 | 1010 (517) | 0.649 (0.110) | |
| P.3 | 20 | 1183 (638) | 0.628 (0.102) | |
|
| ||||
| Canines | C.1 | 6 | 606 (256) | 0.682 (0.102) |
| C.2 | 22 | 546 (227) | 0.682 (0.088) | |
| C.3 | 27 | 695 (370) | 0.635 (0.108) | |
|
| ||||
| Incisors | I.1 | 7 | 686 (410) | 0.681 (0.080) |
| I.2 | 8 | 910 (464) | 0.637 (0.105) | |
| I.3 | 8 | 767(361) | 0.627 (0.102) | |
In order to investigate scallop shape, circularity of the scallops was determined which is defined as:
| (eq. 1) |
where A is the scallop area and P the perimeter. A perfect circle has a circularity of 1.0; all other objects have a circularity of less than 1.0. We tested the null hypothesis that (a) the mean scallop area for all tooth types will be equal (i.e. there will be no main effect for tooth type) and (b) the mean area for different specimens of the same tooth type will be equal (i.e. there will be no main effect for different specimens). To account for correlation between the scallops within a tooth vs. correlation between the scallops between different teeth, results were analysed using a 4 × 3 repeated measures two-way analysis of variance (ANOVA; SPSS Statistics 17.0, SPSS Inc., Chicago, IL, USA) followed by Bonferroni pair-wise comparison of tooth types; p < 0.05 was considered significant. Results for circularity were analysed in an analogous manner.
3. Results
After the enamel was removed, the scalloped structure of the DEJ was exposed (Fig. 1). In most specimens scallop boundaries were clearly defined. Towards the cervical area, scalloped structure became weaker with the boundaries being poorly defined. Scallop sizes of posterior teeth appear larger than those of anterior teeth.
Figure 1.
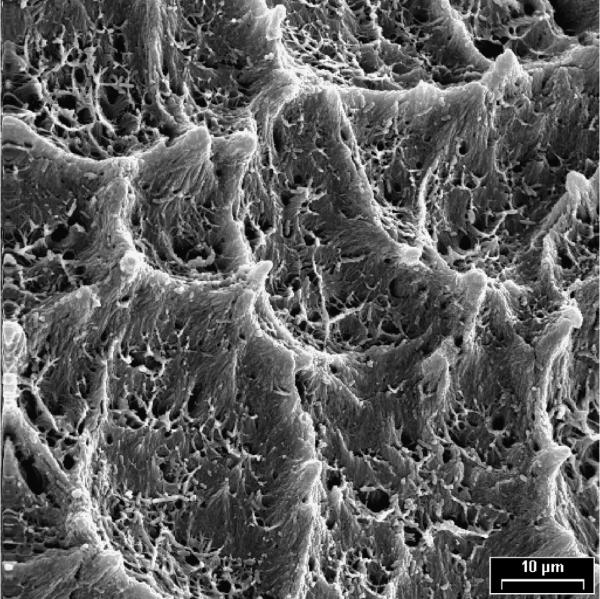
SEM image of specimen M.1 (left mandibular third molar): scallops and microscallops, original magnification: 1500 ×.
Results of statistical analysis including standard deviation and confidence intervals are summarised in Table 1. A 4 × 3 repeated measures two-way analysis of variance was conducted to determine whether scallop area varied with tooth type (molars, premolars, canines and incisors) and between different specimens of the same tooth type. Results of the analysis indicated a main effect for tooth type, F(3,177) = 67.102, p < 0.05, with the scallops of molars having the largest area (M = 1311 μm2), followed by premolars (M = 1130 μm2), incisors (M = 788 μm2) and canines (M = 616 μm2). There was also a main effect for specimen, F(2,118) = 26.898, p < 0.05, and there were differences between patterns of area for tooth types across specimens (i.e. type*specimen interaction) F(6,354) = 19.042, p < 0.05. This means that we need to reject our null hypothesis. Bonferroni pairwise comparison shows that despite the small number of tooth samples, differences between tooth types were within the level of significance (p < 0.05). Results of statistical analysis of scallop area with tooth type for all specimens are shown in Fig. 2.
Figure 2.

Scallop area ± 95% confidence interval for tooth types and specimens. Differences between tooth types and specimens are statistically significant (p < 0.05).
As third molars, which were used in this study, are known to show variation in their morphology and structure compared to other teeth, a 3 × 3 repeated measures two-way ANOVA was conducted for premolars, canines and incisors only. Results showed a main effect for tooth type, F(2,118) = 63.715, p < 0.05, and a main effect for tooth specimen, F(2,118) = 8.052, p < 0.05. There was no significant interaction effect.
In an additional 4 × 3 repeated measures two-way ANOVA it was studied whether scallop circularity varied with tooth type and between different specimens of the same tooth type. For circularity, results of the analysis indicated no main effect for type F(3,177) = 1.275, p > 0.05. There was, however, a main effect for specimen, F(2,118) = 12.225, p < 0.05. No interaction effects (type*specimen) were found, F(6,354) = 0.977, p > 0.05. Results for scallop shape (circularity) are shown in Table 2. As the main effect for specimen is significant for both scallop area and circularity, results are presented for each specimen rather than pooled together for tooth types (Table 1).
Within scallops smaller structures, known as microscallops,3 are found (Fig. 1). Appearance of these microscallops varies greatly and in several specimens they were hardly visible. Due to this variation in visibility and appearance, size of microscallops was not evaluated statistically.
For each specimen, scallop area was determined at three locations, as Whittaker had reported differences in scallop size with intratooth location.7 In our study, one specimen (a right mandibular canine) showed differences in scallop size with intratooth location during preliminary qualitative inspection. This might be caused by the fact that in the cervical area the clear distinction between “scallop boundaries” and “inner septae” (i.e. structures within a scallop) was not possible, resulting in a much smaller apparent scallop area. Due to this uncertainty, this specimen was not included in the evaluation and was replaced by another canine. Of those samples included in statistical evaluation (3 teeth for each type: molars, premolars, canines and incisors), one specimen showed significant differences in scallop area with intratooth location (P.2, repeated measures one-way ANOVA, p < 0.05).
4. Discussion
The fact that the DEJ rarely shows failure despite uniting two mechanically and structurally dissimilar calcified tissues was attributed to the gradual change in mechanical properties,1,8,14 the presence of collagen fibrils2-5 or the softer zone of dentine near the DEJ.15 In addition, the scalloped microstructure of the DEJ was suggested to play a vital role in its performance: it provides mechanical interlocking, increases the surface area, thus increasing the number of bridging collagen fibrils, and it may reduce interfacial stress concentration due to stress dissipation.3,8
Modelling experiments by Shimizu and Macho confirmed this view:10 the authors modelled scalloped and straight DEJ versions and stress distribution during loading. While having higher maximum tensile stresses, stress concentration in a scalloped DEJ is discontinuous whereas in a straight DEJ the continuous stress distribution in one direction would induce delamination. Furthermore, the stress distribution in scalloped DEJ actually pushes the tissues (i.e., dentine and enamel) together. While Shimizu and Macho as well as other authors suggest that scallops are an exaptation rather than a functional adaption10,16 their results still show that scallops prevent enamel delamination and thus are important for tooth performance.
The aim of our study was to investigate if scallop area and shape vary with tooth type (molars, premolars, canines and incisors). Significant differences in scallop diameter for molars and incisors were reported earlier but differences in scallop size with intratooth location, on the other hand, were statistically not significant.9 This was confirmed in our study, which showed little evidence of intratooth variation in scallop size. Results for scallop circularity in our study showed a main effect for specimen only, the main effect for tooth type and the interaction effect failed to reach the level of significance.
For scallop area, our results showed significant main effects for both tooth type and specimen, which suggests that there are significant differences in area between different tooth types and between different specimens. Despite the small number of tooth samples, when tested statistically (using a repeated measures two-way ANOVA followed by Bonferroni pairwise comparison), differences between tooth types were found to be within the level of significance (p < 0.05). However, there was a significant interaction effect, suggesting that the differences between tooth types depend on the specimen.
Fig. 2 shows that molars in particular showed variation between specimens. This is not surprising, as third molars were used in this study (due to their ready availability), which are known to show great variation in their morphology and structure, compared to first and second molars. A repeated measures two-way ANOVA of scallop area of premolars, canines and incisors only, therefore, showed main effects for type and specimen, but no interaction effect. This suggests that the interaction effect seen for all four types was caused by this variation in scallop area of the third molars used in our study.
Our results show that the relationship between scallop area and tooth type is complex, which makes more detailed studies using a larger number of replicates necessary. Meanwhile, our results suggest that posterior teeth show larger scallops than anterior teeth, which indicates that teeth which are subject to larger masticatory loads (molars and premolars) have larger and more pronounced scallops than anterior teeth.
Understanding of the structure-property relationship at the DEJ might be useful to improve joining of other materials with dissimilar mechanical properties. It is known that, for example, the dentine-composite restoration deteriorates with time, causing leakage, while enamel-composite interfaces are more stable.17 Recent results suggest that the interface between enamel and resin restoration shows a scalloped structure similar to that of the DEJ (Fig. 3): the major features are a honeycombed appearance resulting from the etching of the enamel rods which measure about 5 μm. This scalloped structure might be the reason why the enamel resin interface performs so well in practice.
Figure 3.
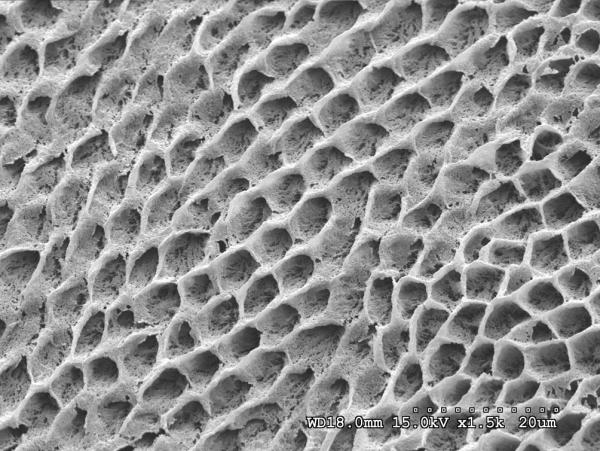
Scalloped microstructure of the enamel resin interface after dissolution of enamel. Sometimes the topography is reversed.
5. Conclusion
The relationship between tooth type and the size of scallops at the DEJ is complex, but results of our preliminary study suggest significant differences exist between tooth types. There was little evidence of intratooth variation in scallop size. Our results indicate that posterior teeth, which are subject to higher masticatory loads, have larger and more pronounced scallops than anterior teeth, which is of interest for use of the DEJ as a biomimetic model to improve mechanical performance in other interfaces.
Acknowledgements
The authors would like to thank Grace Nonomura for collection of tooth samples and Dr Kuniko Saeki for help with Scion Image. Support by NIH/NIDCR Grant P01DE09859 is gratefully acknowledged.
Footnotes
Publisher's Disclaimer: This is a PDF file of an unedited manuscript that has been accepted for publication. As a service to our customers we are providing this early version of the manuscript. The manuscript will undergo copyediting, typesetting, and review of the resulting proof before it is published in its final citable form. Please note that during the production process errors may be discovered which could affect the content, and all legal disclaimers that apply to the journal pertain.
References
- 1.Imbeni V, Kruzic JJ, Marshall GW, Marshall SJ, Ritchie RO. The dentin-enamel junction and the fracture of human teeth. Nature Materials. 2005;4:229–32. doi: 10.1038/nmat1323. [DOI] [PubMed] [Google Scholar]
- 2.Dong XD, Ruse ND. Fatigue crack propagation path across the dentinoenamel junction complex in human teeth. Journal of Biomedical Materials Research Part A. 2003;66A:103–9. doi: 10.1002/jbm.a.10541. [DOI] [PubMed] [Google Scholar]
- 3.Lin CP, Douglas WH, Erlandsen SL. Scanning electron-microscopy of type I collagen at the dentin-enamel junction of human teeth. Journal of Histochemistry & Cytochemistry. 1993;41:381–8. doi: 10.1177/41.3.8429200. [DOI] [PubMed] [Google Scholar]
- 4.Rasmussen ST. Fracture properties of human teeth in proximity to the dentinoenamel junction. Journal of Dental Research. 1984;63:1279–83. doi: 10.1177/00220345840630110501. [DOI] [PubMed] [Google Scholar]
- 5.Lin CP, Douglas WH. Structure-property relations and crack resistance at the bovine dentin-enamel junction. Journal of Dental Research. 1994;73:1072–8. doi: 10.1177/00220345940730050901. [DOI] [PubMed] [Google Scholar]
- 6.Ten Cate AR. Oral Histology: Development, Structure and Function. 5th ed Mosby; St. Louis, MO: 1998. [Google Scholar]
- 7.Whittaker DK. Enamel-dentine junction of human and Macaca Irus teeth - light and electron microscopic study. Journal of Anatomy. 1978;125:323–35. [PMC free article] [PubMed] [Google Scholar]
- 8.Fong H, Sarikaya M, White SN, Snead ML. Nano-mechanical properties profiles across dentin-enamel junction of human incisor teeth. Materials Science & Engineering C-Biomimetic and Supramolecular Systems. 2000;7:119–28. [Google Scholar]
- 9.Marshall SJ, Balooch M, Habelitz S, Balooch G, Gallagher R, Marshall GW. The dentin-enamel junction - a natural, multilevel interface. Journal of the European Ceramic Society. 2003;23:2897–904. [Google Scholar]
- 10.Shimizu D, Macho GA. Functional significance of the microstructural detail of the primate dentino-enamel junction: A possible example of exaptation. Journal of Human Evolution. 2007;52:103–11. doi: 10.1016/j.jhevol.2006.08.004. [DOI] [PubMed] [Google Scholar]
- 11.White JM, Goodis HE, Marshall SJ, Marshall GW. Sterilization of teeth by gamma-radiation. Journal of Dental Research. 1994;73:1560–7. doi: 10.1177/00220345940730091201. [DOI] [PubMed] [Google Scholar]
- 12.Brauer DS, Saeki K, Hilton JF, Marshall GW, Marshall SJ. Effect of sterilization by gamma radiation on nano-mechanical properties of teeth. Dental Materials. 2008;24:1137–40. doi: 10.1016/j.dental.2008.02.016. [DOI] [PubMed] [Google Scholar]
- 13.Perdigão J, Lambrechts P, Van Meerbeek B, Vanherle G, Lopes ALB. Field emission SEM comparison of four postfixation drying techniques for human dentin. Journal of Biomedical Materials Research. 1995;29:1111–20. doi: 10.1002/jbm.820290911. [DOI] [PubMed] [Google Scholar]
- 14.Habelitz S, Marshall SJ, Marshall GW, Balooch M. The functional width of the dentino-enamel junction determined by AFM-based nanoscratching. Journal of Structural Biology. 2001;135:294–301. doi: 10.1006/jsbi.2001.4409. [DOI] [PubMed] [Google Scholar]
- 15.Zaslansky P, Friesem AA, Weiner S. Structure and mechanical properties of the soft zone separating bulk dentin and enamel in crowns of human teeth: Insight into tooth function. Journal of Structural Biology. 2006;153:188–99. doi: 10.1016/j.jsb.2005.10.010. [DOI] [PubMed] [Google Scholar]
- 16.Radlanski RJ, Renz H. Insular dentin formation pattern in human odontogenesis in relation to the scalloped dentino-enamel junction. Annals of Anatomy-Anatomischer Anzeiger. 2007;189:243–50. doi: 10.1016/j.aanat.2006.11.007. [DOI] [PubMed] [Google Scholar]
- 17.De Munck J, Van Landuyt K, Peumans M, Poitevin A, Lambrechts P, Braem M, et al. A critical review of the durability of adhesion to tooth tissue: Methods and results. Journal of Dental Research. 2005;84:118–32. doi: 10.1177/154405910508400204. [DOI] [PubMed] [Google Scholar]