An official website of the United States government
Here's how you know
Official websites use .gov
A
.gov website belongs to an official
government organization in the United States.
Secure .gov websites use HTTPS
A lock (
) or https:// means you've safely
connected to the .gov website. Share sensitive
information only on official, secure websites.

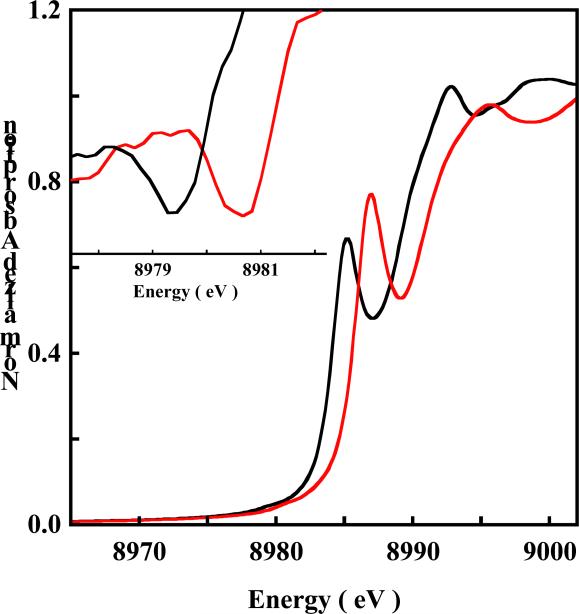
 ) and (TBA)[Cu(MNT)2] 1ox (
 ). Inset shows the second derivative of the pre-edge region (1s → 3d transition, ~8978-8982 eV) indicating a ~1.4 eV shift.