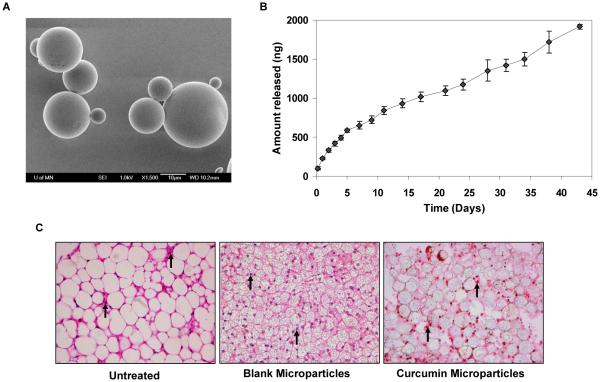
Figure 1.
A, SEM image of curcumin-loaded PLGA microparticles. Microparticles were placed on a double stick tape and carbon coated before observation under an electron microscope. 1500X magnification. Bar is 10 μm. B, In vitro release of curcumin from microparticles. Microparticles (equivalent to 2 μg of curcumin), suspended in 1 ml release buffer, were added on top of the Transwell® insert and 3 ml release buffer was added to the bottom of the well. The bottom chamber was sampled at different time intervals. Curcumin concentrations were quantified by HPLC. Data shown is mean ± SD, n=3. C, H & E staining of subcutaneous tissues from the vicinity of the injection site (left – untreated; middle – blank microparticle treated; and right - curcumin microparticle treated). Arrows indicate inflammatory cells. 400X magnification.

