
Figure 7. Imaging of hMSC-scFv EGFRvIII in flank U87 tumor expressing EGFRvIII.
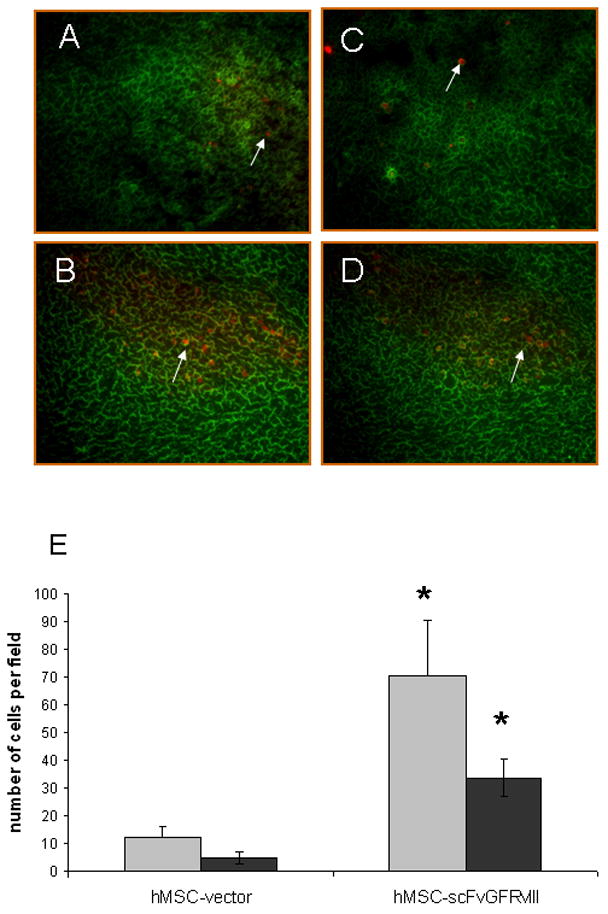
hMSC-vector and hMSC-scFvEGFRvIII expressing RFP were injected in the right flank of U87-EGFRvIII GFP expressing tumor. Tumor tissues were frozen on day 5 and 15 after injection of hMSC. Cryosections (20 microns) were analyzed using Olympus IX70 inverted microscope and MetaMorph software. Original magnification 10×. (A) and (C) show hMSC-vector within the tumor on day 5 and day 15, respectively, after the stem cells injection. (B) and (D) show hMSC-scFvEGFRvIII within the tumor on day 5 and day 15, respectively. Panel E shows the summary of the quantification of hMSC in tumors sections. Gray and black bars show the data at day 5 and 15, respectively. * p< 0.005 vs. hMSC-vector.