
Figure 2.
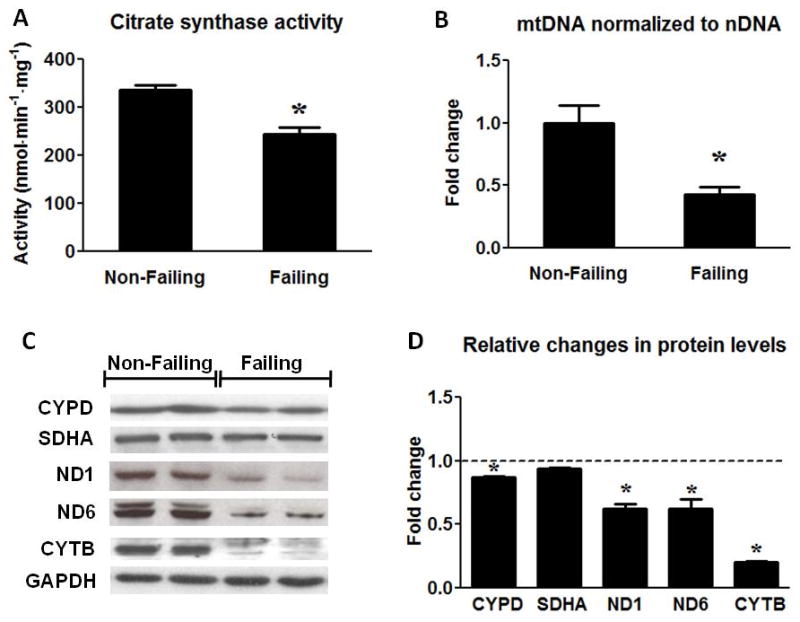
Assessment of mitochondrial protein and mtDNA content. (A) Citrate Synthase activity in the Non-Failing (n=10) and the Failing (n=23) hearts. (B) mtDNA content normalized to nDNA in the Failing (n=23) group compared to the Non-Failing controls (n=9). (C) Representative Western blots for CYPD, SDHA, ND1, ND6, CYTB and GAPDH (two samples per group) and (D) average fold changes of the Failing (n=6) relative to the Non-Failing controls (indicated by the dashed line; n=5). Data are given as the mean of the fold changes ± SEM relative to the Non-Failing hearts (* p<0.05 vs. Non-Failing).