
Figure 5.
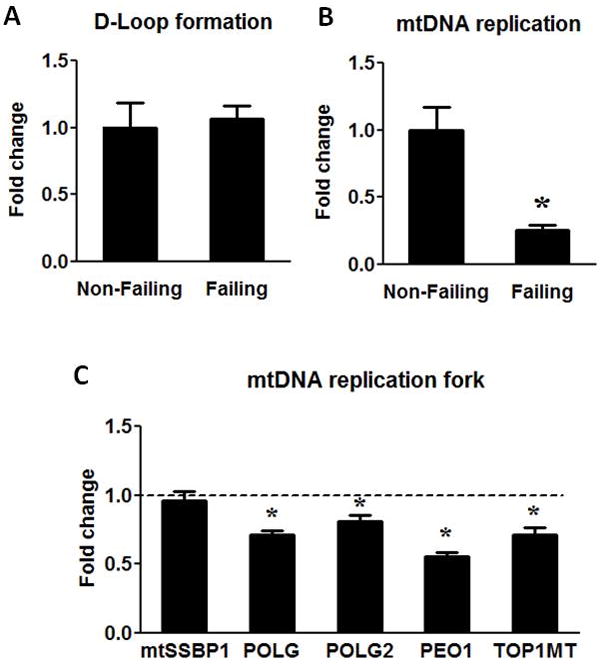
mtDNA replication. (A) The D-Loop formation was assessed by measuring the 7S DNA and normalized to mtDNA amount. (B) mtDNA replication was assessed by measuring the extension of 7S DNA beyond the D-Loop and normalized to mtDNA. (C) mRNA levels of mtSSBP1, POLG, POLG2, PEO1 and TOP1MT. Data are given as the mean of the fold changes ± SEM of the Failing (n=23) group relative to the Non-Failing (n=9) group (* p<0.05 vs. Non-Failing).