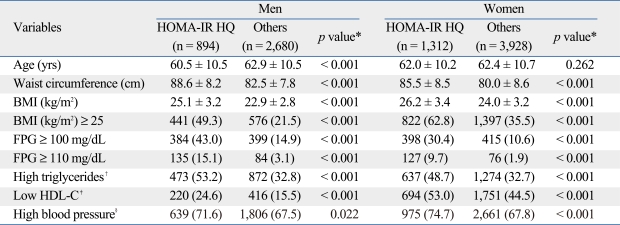
Table 2.
Comparison of Metabolic Risk Factors between Insulin Resistant Subjects and Others by Gender
HOMA-IR HQ, homeostatic model assessment of insulin resistance highest quartile; BMI, body mass index; FPG, fasting plasma glucose; HDL-C, high-density lipoprotein cholesterol.
Data are summarized as a mean ± SD or n (%).
*p values were obtained using t-test or chi-square test.
†Triglycerides ≥ 150 mg/dL.
‡HDL-C < 50 for men and HDL-C < 40 for women.
§Systolic blood pressure ≥ 130 mmHg or diastolic blood pressure ≥ 85 mmHg or antihypertensive medication of previously diagnosed hypertension.

