Figure 6.
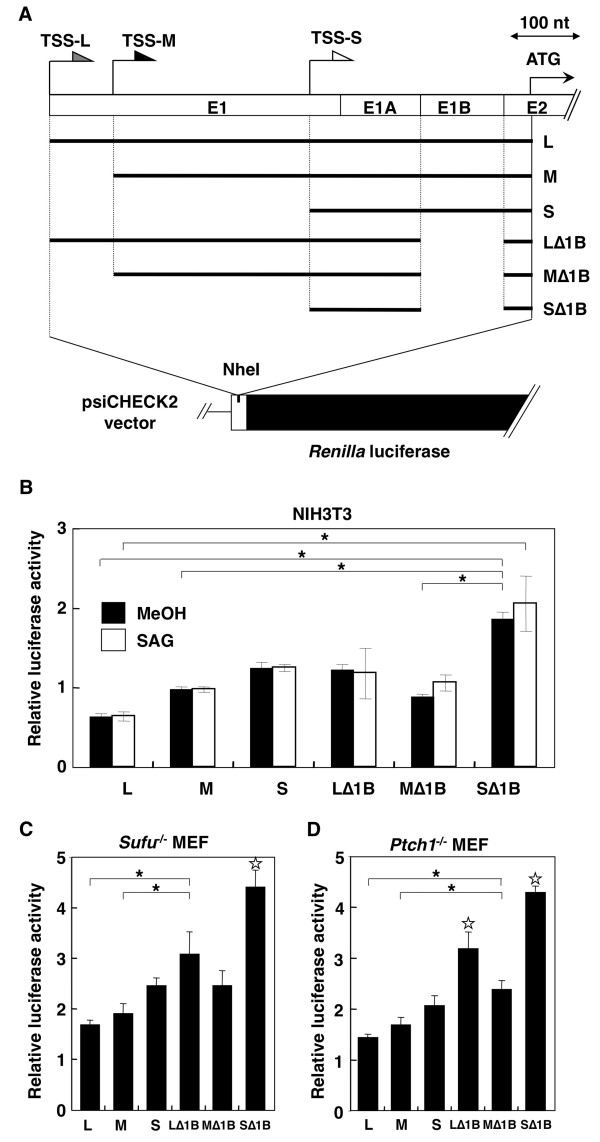
Functional differences of the Gli1 5' UTR variants. (A) Schematic representation of the six Gli1 5' UTRs analyzed. The alternative TSSs, the individual exons and the initiator methionine codon are represented as in Figure 2A. Bold lines indicate the six 5' UTR regions, L, M, S, LΔ1B, MΔ1B, SΔ1B, which were cloned into the NheI site, upstream of the Renilla luciferase coding region (black box) of the psiCHECK2 vector as described in methods. (B, C, and D) Luciferase activity of the six reporter constructs after transfection into NIH3T3 cells, Sufu-/- MEFs, and Ptch1-/- MEFs, respectively. Transfected NIH3T3 cells were treated with methanol (MeOH) or SAG. The Renilla luciferase activity was normalized relative to that of the Firefly luciferase. The error bars indicate the standard deviation. The statistical significance of the differences among the Gli1 5' UTR constructs is shown. (*: p < 0.01, ANOVA - Bonferroni test. The white star indicates significance relative to all other data sets).

