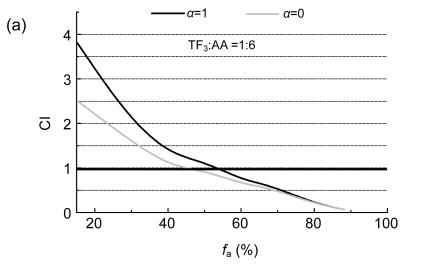
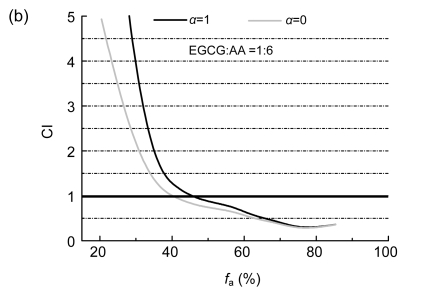
Fig. 2.
Combination index (CI) plots of interactions between TF3, EGCG, and AA
SPC-A-1 cells were treated with tea polyphenol monomers and AA at a fixed molar ratio: (a) TF3:AA =1:6 and (b) EGCG:AA=1:6. Using the mutually exclusive or mutually non-exclusive isobologram equation, the affected fraction (f a)-CI plots for SPC-A-1 cells were constructed by computer analysis of the data generated from the median effect analysis. CI<1 occurred over a wide range of inhibition levels, indicating synergism


