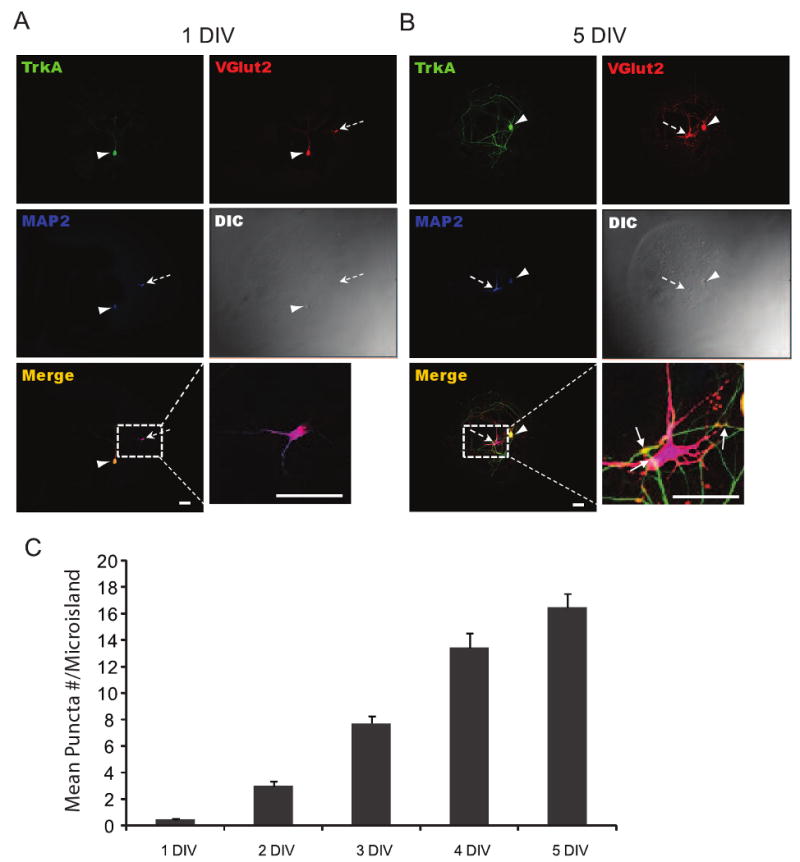
Fig. 3.

Time-course for accumulation of nociceptive DRG and dorsal horn synaptic boutons. (A, B) representative immunostaining images at day 1 and 5 against TrkA, VGlut2, and MAP2. Arrowhead and broken arrow point to a DRG and dorsal horn neuron, respectively. Insets in lower left and right panels of A and B illustrate the triple-labeled boutons (Arrows) quantified in C. The number of synaptic boutons increased over time in culture (0.48 ± 0.1, 3 ± 0.30, 7.7 ± 0.64, 13.4 ± 1.1, 16.4 ± 1.02 for 1-5 DIV cultures, respectively; P<0.0001 by ANOVA test, n≥27 for each time point). All values are given in ± SEM and scale bars are 50μm.
