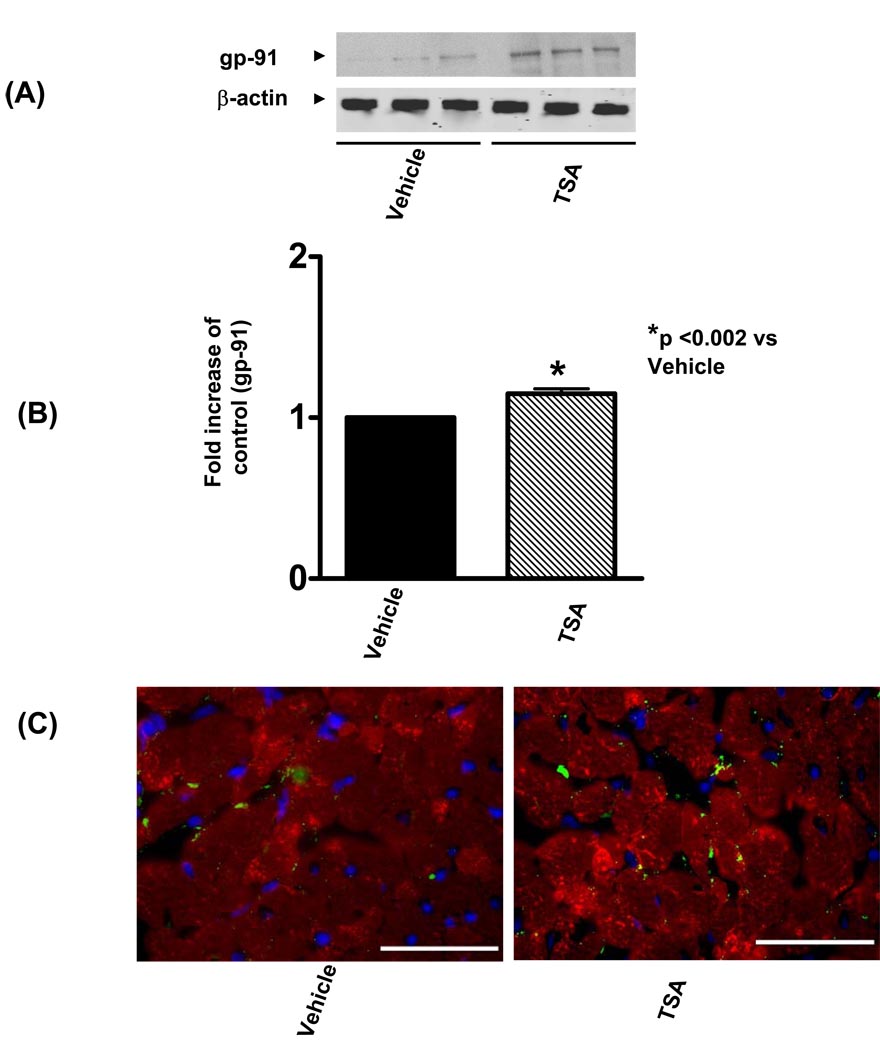
Figure 4.
(A): Representative Western blot showing the effect of TSA on gp-91 in the myocardium. (B): Quantification of gp-91 in the myocardium after TSA stimulation. The densitometric signal was normalized to the vehicle group and expressed as a percentage. Results are means ± SE (n=3/group), *P<0.002 vs vehicle. (C): the myocytes were stained with anti-sarcomeric actinin (red), gp-91 proteins were stained with anti-gp-91 (green). Nuclei were stained with 4'6-diamidino-2-phenylindole (DAPI, blue). Images show an overlay of myocytes, gp-91 and nuclei. Left panel represents vehicle-treated group and right panel represents TSA-treated hearts. Bar =50µm.

