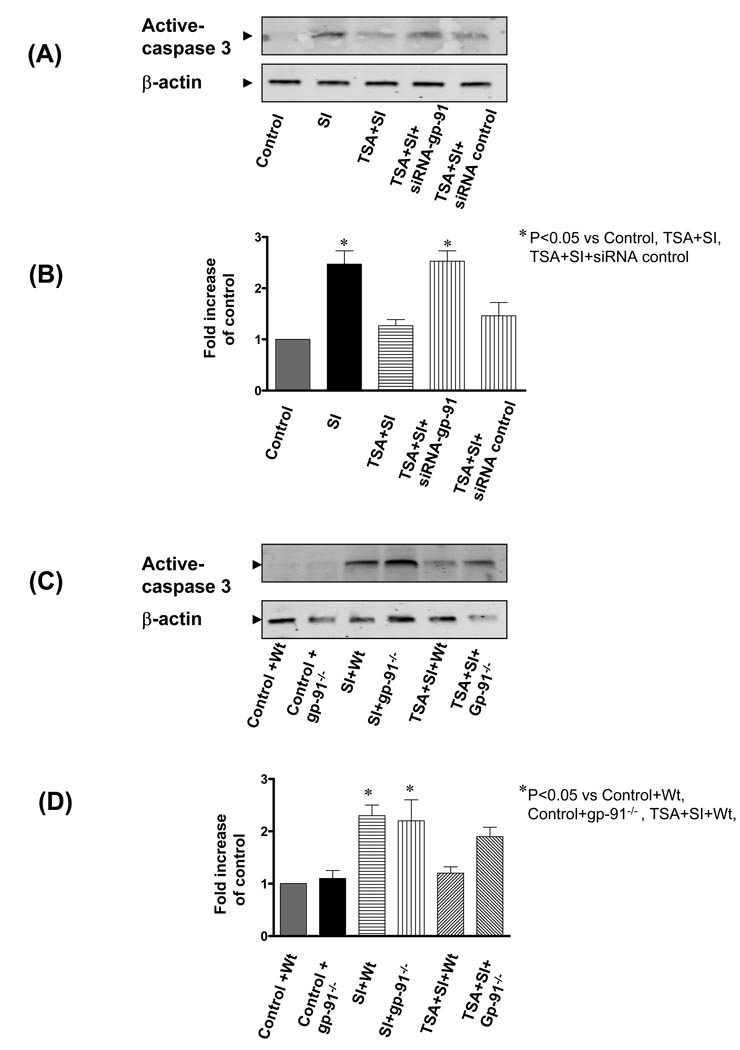
Figure 8.
(A): Representative Western blots of caspase-3 in H9c2 cardiomyoblast cells exposed to simulated ischemia; blots were probed with anti-active caspase-3; (B): The densitometric signal was normalized to the control group and expressed as a percentage. (C): Representative immunoblot showing active caspase-3 in PLB-985 wild type and gp91phox-deficient PLB-985 cells. (D): The densitometric signal was normalized to the control group and expressed as a percentage. SI: Simulated ischemia; Wt: wild-type PLB-985 cells; Control: Without simulated ischemia. Results are expressed as means ± SE and the values expressed as percentages of control values (n=3/group). *P < 0.05.

