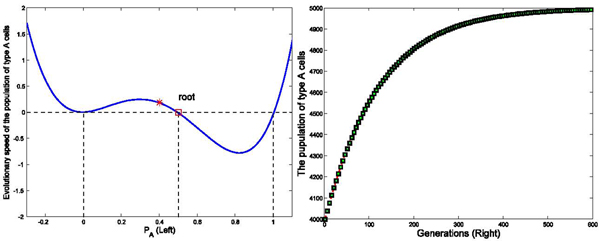
Figure 5.
Effects of initial status on the stability of the dynamic network with different interaction matrix (PA ∈ (0, 1)) Figure 5 shows the evolutionary dynamics with interaction matrix as [0 1; 1 0], k=4, and initial populations of A and B are as 4000 and 6000 in a total population of 10000 cells. The intensity of selection equals to 0.01. ṖA is positive when the initial status of PA stays between 0 and the marked root (red square) in the left part of figure (Left). Accordingly, the population of type A cells increases from the initial status in the interval of [0, root] until PA goes to the root denoted at 0.5 in this simulation. The simulation results shown in the right part of Figure 5 (Right) demonstrate that the population of type A cells approaches 5000 within 800 generations.

