Figure 1.

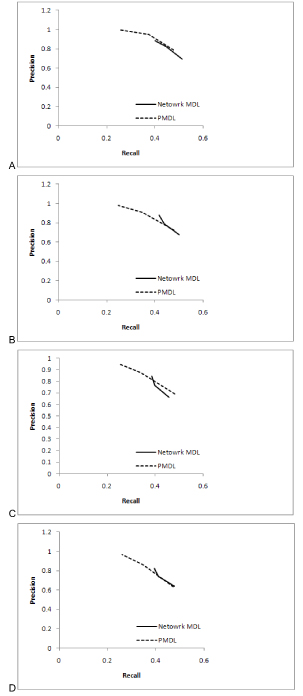
Precision vs. recall curves for (A) 20 genes (B) 30 genes (C) 40 genes (D) 50 genes. The data is quantized to 2 levels in all cases. The precision vs. recall graphs for the network MDL and PMDL algorithms are shown in this figure.

Precision vs. recall curves for (A) 20 genes (B) 30 genes (C) 40 genes (D) 50 genes. The data is quantized to 2 levels in all cases. The precision vs. recall graphs for the network MDL and PMDL algorithms are shown in this figure.