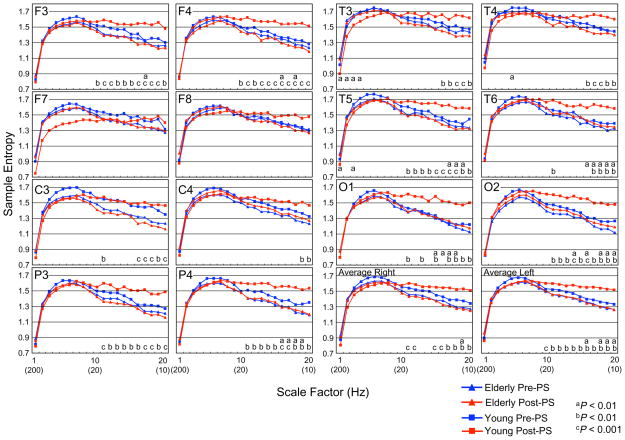
Fig. 2.
Multiscale entropy (MSE) analysis of 13 elderly subjects (triangle) and 12 young subjects (square) in both pre (blue)-PS and post (red)-PS condition for each site and average of each site. Each panel presents the average of the left and right MSE values. Post-hoc comparisons between the pre-PS and post-PS conditions in young subjects: aP < 0.01. Post-hoc comparisons between young and elderly subjects in the post-PS condition: bP < 0.01, cP < 0.001. (For interpretation of the references to color in this figure legend, the reader is referred to the web version of this paper.)

