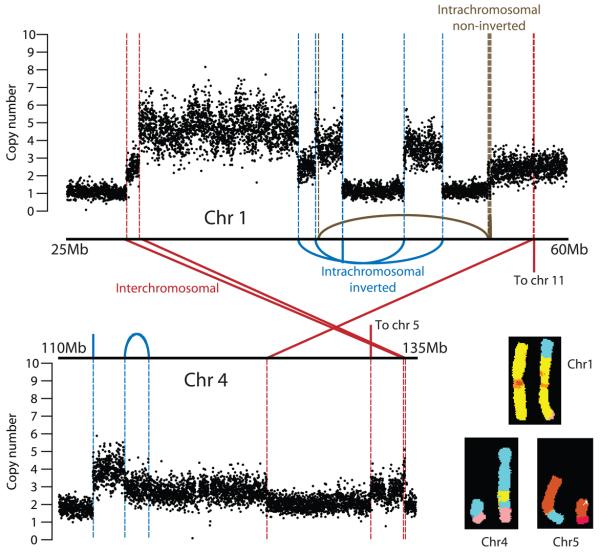
Figure 3.
Localised complexes of somatically acquired genomic rearrangements in NCI-H209. Copy number plots across regions on chromosomes 1 and 4 are shown. Inverted intrachromosmal rearrangements (blue), non-inverted intrachromosomal rearrangements (brown) and interchromosomal rearrangements (red) are shown in relation to copy number changes. The inset shows the representative chromosomes on spectral karyotyping. There are three breakpoints between chromosome 1 (yellow) and 4 (light blue), and a translocation between chromosomes 4 and 5 (tan).

