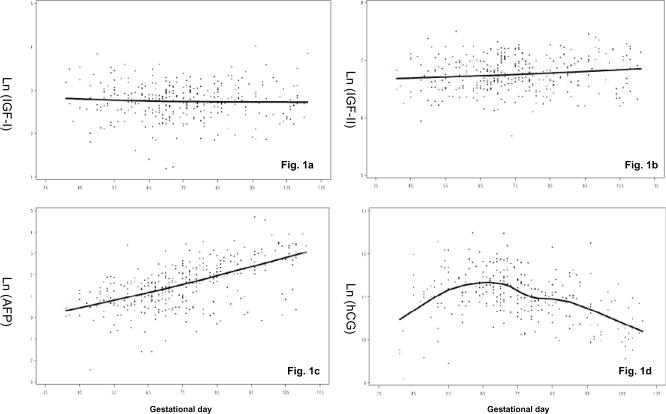
Figure 1.
Scatterplot of log-scale IGF-I (Fig.1a), IGF-II (Fig.1b), AFP (Fig.1c), and hCG (Fig.1d) by gestational day in 338 uncomplicated pregnancies from the Northern Sweden Maternity Cohort, 1975–2001. The solid line shows the progression of hormones during pregnancy, estimated by local linear regression [18].

