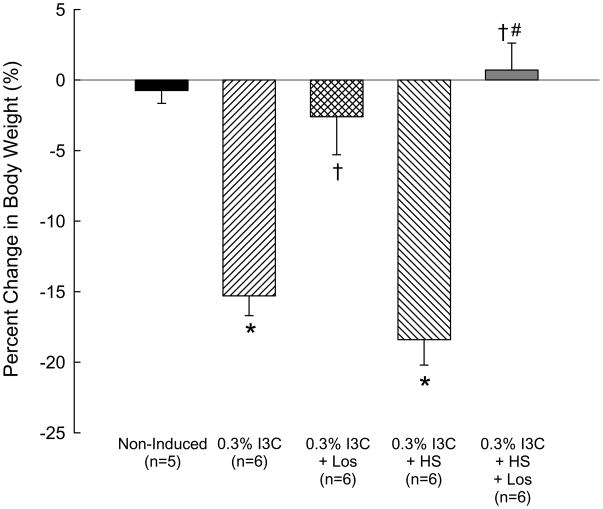
Fig. 2.
Percent change from baseline in body weights of non-induced Cyp1a1-Ren2 rats (Non-induced); Cyp1a1-Ren2 rats fed a normal-salt diet containing 0.3% I3C for 10 days (0.3% I3C); Cyp1a1-Ren2 rats induced for 10 days with 0.3% I3C and treated with the AT1 receptor antagonist, losartan (Los; 100 mg/L in drinking water) (0.3% I3C+Los); Cyp1a1-Ren2 rats induced with I3C and fed a high salt diet (HS) (0.3% I3C+HS); and Cyp1a1-Ren2 rats induced with 0.3% I3C, fed a HS diet and treated with losartan (Los; 100 mg/L in drinking water) (0.3% I3C+HS+Los). *P<0.001 vs. non-induced; † P<0.001 vs. 0.3% I3C; # P<0.001 vs. 0.3% I3C+HS.

