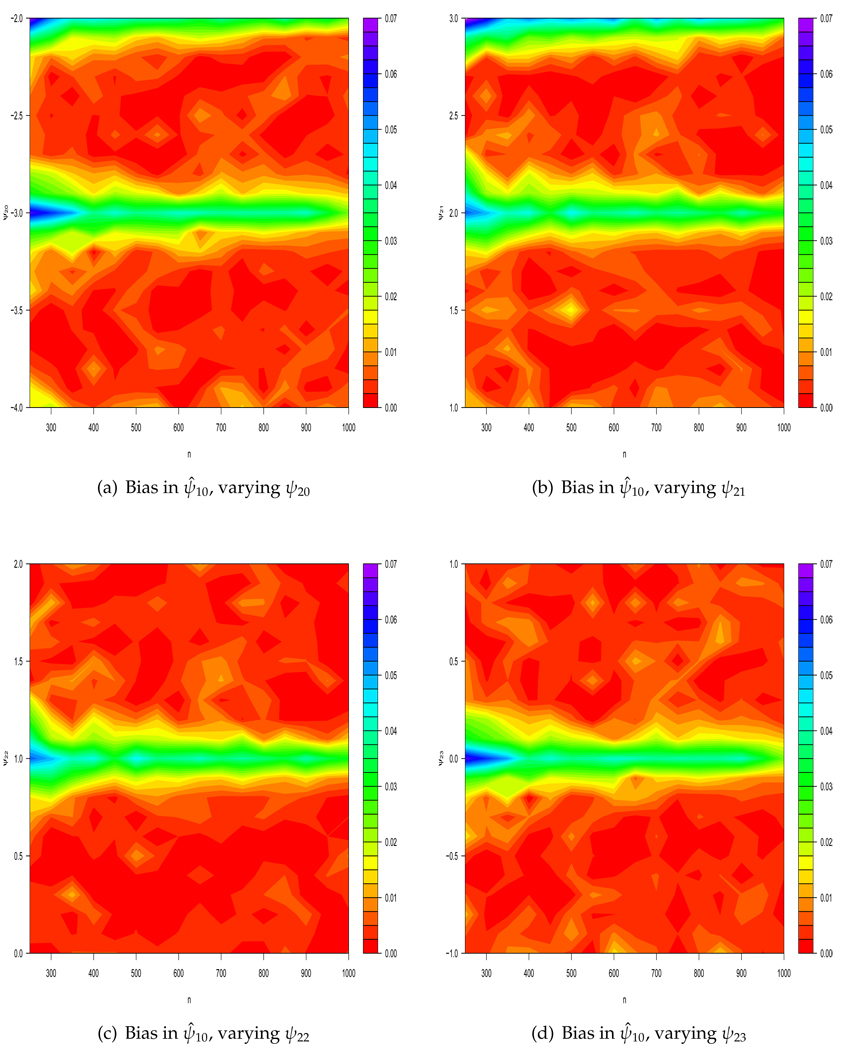
Figure 1.
Absolute bias of ψ̂10 as sample size varies at and near exceptional laws. In each figure, one of ψ20, ψ21, ψ22, ψ23 is varied while the remaining are fixed at −3.0, 2.0, 1.0, or 0.0, respectively. Note that there are several combinations of parameters that lead to exceptional laws: as well as (−3.0, 2.0, 1.0, 0.0) with p(A1 = L2 = 1) > 0, exceptional laws occur with (−2.0, 2.0, 1.0, 0.0) and (−3.0, 3.0, 1.0, 0.0) if p(A1 = 0, L2 = 1) > 0.

