
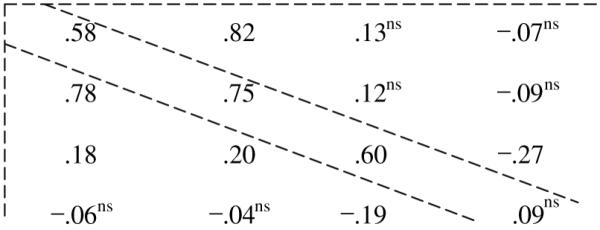
Table 1.
Means and standard deviations with matrix of Pearson correlations: sub-sample 1 in rows and below diagonal, sub-sample 2 in columns and above diagonal, twin intra-class correlations on diagonal
| Sub-sample 2 |
|||||
|---|---|---|---|---|---|
| Word Attack | Word Ident. | Eff. Control | Surgency | ||
| Sub-sample 1 | M (SD) | 110.7 (11.2) | 112.2 (12.7) | 5.34 (.68) | 4.43 (.90) |
| Word Attack | 110.1 (12.1) |
|
|||
| Word Identification | 112.1 (12.8) | ||||
| Effortful Control | 5.38 (.58) | ||||
| Surgency | 4.45 (.74) | ||||
Note: All correlations significant at p < .05 (two-tailed) unless ns (non-significant). Descriptive statistics for Effortful Control and Surgency based on mothers’ reports, which were not significantly different from fathers’ reports. Mothers’ and fathers’ reports were averaged prior to estimation of correlations and for subsequent regression analyses