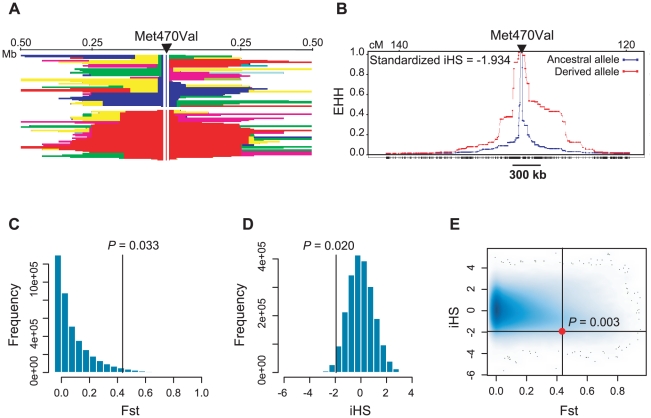
Figure 4. Population genetic parameters of the CFTR Met470Val locus.
(A) Haplotype blocks +/− 500 kb around Met470Val locus in HapMap CEU (phase II) samples. The arrow indicates the location of Met470Val; the blue vertical line shows the ancestral Met470 allele and the red vertical line shows the derived Val470 allele. A continuous block of the same color represents the haplotypes shared between individuals. Haplotypes on the Met470 background are shorter and more variable compared to those on Val470 background. (B) Decay of extended haplotype homozygosity (EHH) around the Met470Val locus in the same data as in (A). The blue plot represents the decay of haplotypes on the ancestral (Met) allele background; the red plot represents the decay of haplotypes on the derived (Val) allele background. The Y-axis shows the EHH, defined as the probability that two randomly chosen chromosomes are homozygous at all SNPs for the entire interval from the core SNP at distance x [37]. EHH probability drops below 0.5 at approximately 300 kb around Met470Val on haplotypes carrying the Val470 allele, compared to <20 kb on haplotypes carrying the Met allele. The iHS corresponds to the natural logarithm of the ratio of areas under the ancestral and derived allele EHH curves, standardized to be independent of the allele frequencies. A negative iHS implies that the haplotypes on derived allele background are longer than those on ancestral background [23]. (C–E) Genome-wide distributions of (C) Fst values, (D) iHS scores and (E) Fst and iHS scores for SNPs in HapMap phase II data. Black lines (and filled circle in E) show the location of the Met470Val SNP in each distribution. Proportions of SNPs with more extreme values are shown on the plots as empirical P-values.

