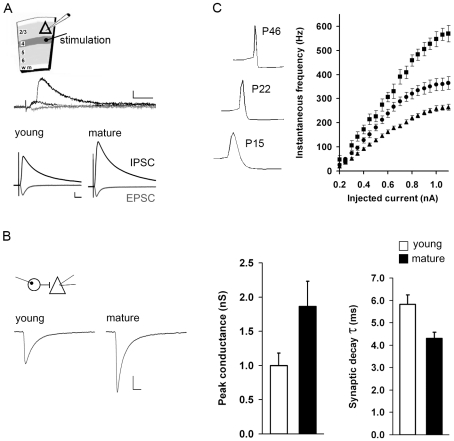
Figure 2. Maturation of GABAergic synaptic and intrinsic properties in primary visual cortex.
(A) Stimulus recording configuration for determining the maximal IPSC amplitude prior to (young) and during (mature) the critical period. Upper trace, example of disynaptic IPSC activity in a layer 2/3 pyramidal neuron in response to stimulation of layer 4, 15 µA intensity. IPSC responses are from two separate trials (black), EPSC (gray); scale bar: 50 pA, 10 ms. Lower traces, amplitude of isolated monosynaptic AMPA-mediated current (EPSC, recorded at the empirically determined GABAA reversal potential, gray) and compound GABAA-mediated current which included both monosynaptic and polysynaptic IPSCs (recorded at 0 mV, black) in layer 2/3 pyramidal neurons in response to stimulation of layer 4. Stimulus input- output curves for a range of stimulation intensities (10–80 µA) were generated (see Figure S1). The average current from all trials in which a 350±50 pA EPSC was elicited is shown here. Young: n = 9 (of 14 cells) fulfilled this criteria, mature: n = 8 (of 13 cell) fulfilled this criteria. The normalized IPSC charge (nA*ms) shown here increased 1.7-fold with age (young, 36.5+/−3.6; mature, 62.0+/−9.8 pC, t-test p<0.05). GABAB and NMDA-mediated currents were blocked. Scale bar: 250 pA, 10 ms. (B) Unitary IPSCs recorded in layer 2/3 pyramidal neurons in response to stimulation of single Pv+ basket interneurons prior to the critical period (n = 14), and during the critical period (n = 19). Left, averaged current responses across all cells. The average IPSC amplitude increased 1.8-fold with age, while the average synaptic decay time-constant decreased roughly 25%, from 5.8 to 4.3 ms. See Table 1 for statistics. (C) Input/output curves of instantaneous firing frequency of Pv+ basket interneurons prior to (n = 27, p14–15, triangles), during (n = 21, p19–23, circles), and at the end of the critical period (n = 5, p44–46, squares). Maximal spike output in response to the same input increased by greater than 2-fold during the course of the critical period (right). There was a corresponding decrease in spike half-width during development, p14–15 (0.96+/−0.18 ms), p19–23 (0.56+/−0.14 ms), p44–46 (0.23+/−0.03 ms), example voltage traces of spike shape shown on the left.

