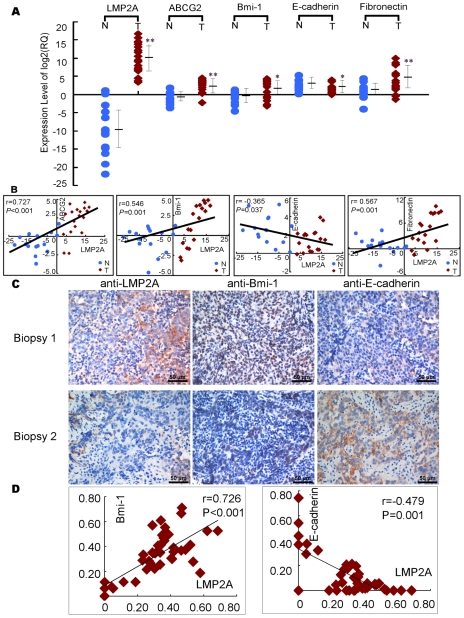
Figure 6. The expression of LMP2A correlates with the expression of EMT and stem cell-related markers in NPC.
A. The mRNA level of LMP2A, ABCG2, Bmi-1, E-cadherin and Fibronectin in NPC biopsy samples and control inflammatory samples measured by real time RT-PCR. T = tumor, N = normal. B. LMP2A correlates positively with ABCG2, Bmi-1, Fibronectin, and negatively with E-cadherin in tissue samples. T = tumor, N = normal. C. The expression of LMP2A, Bmi-1 and E-cadherin in a cohort of NPC biopsy using immunohistochemistry assay. Final magnification 40X, scale bar = 50 µm. D. LMP2A significantly correlates with Bmi-1and E-cadherin in NPC tissues. The coordinate axis equals to the percentage of positive cells in whole cancer cells.

