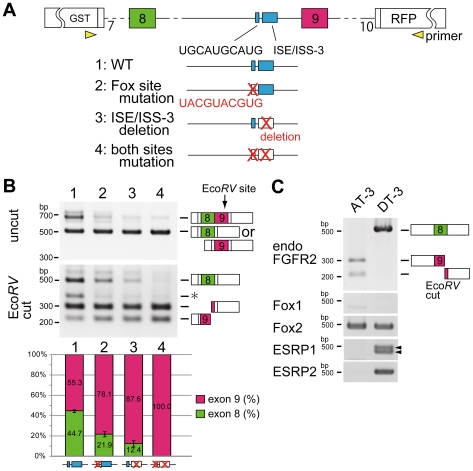
Figure 4. Identification of silencing elements for exon 9 recognition.
(A) Scheme of cis-mutation experiment on UGCAUG and ISE/ISS-3 which is located upstream of exon 9. Red characters indicated mutated sequences or deletions. (B) RT-PCR from AT-3 cell into which the indicated vectors were introduced. The bar graph shows the amount of each splicing product, and is based on calculations from three independent experiments; the mean value for each splice product is show in the respective column, with an error bar showing the SD (standard error). (C) RT-PCR from AT-3 and DT-3 cells showing amplified endogenous FGFR2, Fox1, Fox2, ESRP1, and ESRP2. The arrowhead in ESRP1 corresponds to two splice isoforms which was confirmed by sequencing.

