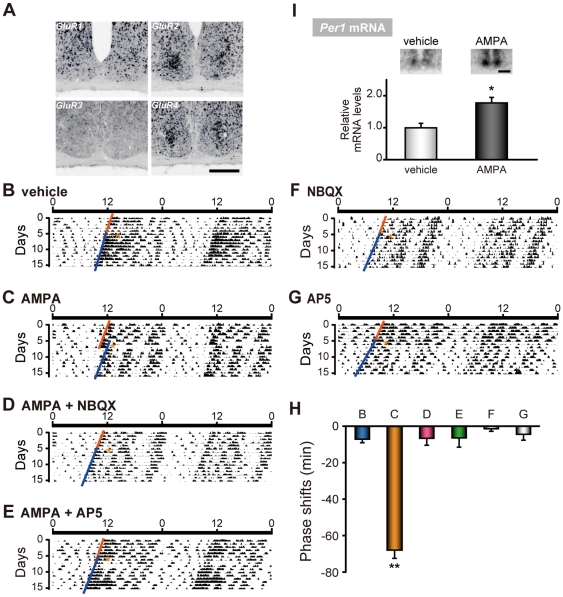
Figure 1. AMPA microinjection at CT14 induced phase delays and Per1 expressions in vivo.
(A) Topographic analysis of AMPA receptor mRNA expressions (GluR1-4) in the mouse SCN by in situ hybridization using digoxigenin-labeled riboprobes. Scale bar, 200 µm. (B–G) Representative double-plotted actograms of circadian locomotor activity rhythms in mice injected with either (B) vehicle, (C) AMPA, (D) AMPA + NBQX, (E) AMPA + AP5, (F) NBQX or (G) AP5. Mice were maintained in constant darkness and microinjections were given at CT14 (marked by asterisks) under dim red light illumination. The magnitude of the phase delays was calculated by comparing eye-fitted lines drawn according to the onset of the locomotor activity before and after the microinjection. (H) Summary of phase delays (Mean ± SEM) induced by microinjection of drugs at CT14. Minus values mean phase delays. Numbers at the bars denote sample sizes for each condition. ** p<0.01 (one-way ANOVA, followed by Scheffe's multiple comparisons). (I) Acute induction of Per1 mRNA (Mean ± SEM) induced by AMPA or vehicle microinjection, detected by in situ hybridization using [33P]-labeled riboprobes. The average value of vehicle microinjection was set to 1. * p<0.05 (Student's t-test). Inset panels show representative autoradiograph images of Per1 mRNA expression induced by vehicle (left) or AMPA (right) microinjection at CT14. Scale bar, 500 µm.

