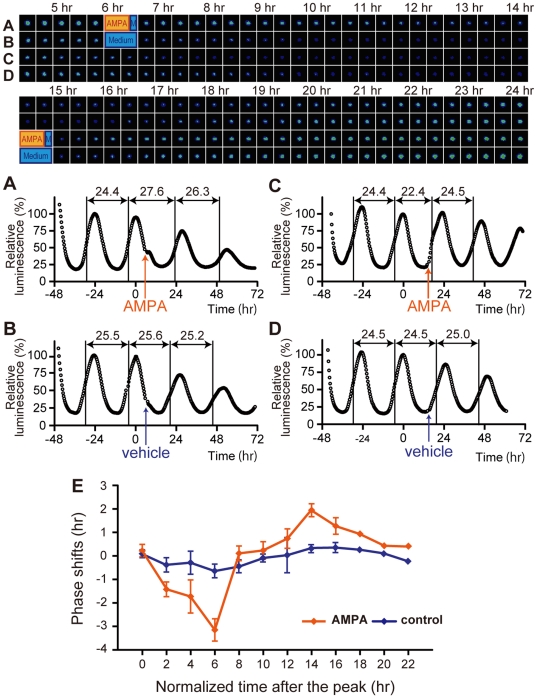
Figure 2. AMPA-induced phase shifts of luminescence rhythms in organotypic SCN slice cultures.
Images of the representative results are shown in the upper panels. The corresponding graphs are shown below, defining the second peak values (time 0) as 100%. AMPA application, (A) at 6 hr or (C) at 14 hr after the peak of the luminescence, induced phase delays and advances, respectively. Control medium treatment without AMPA (B) at 6 hr or (D) at 14 hr after the peak had no effect on the phase. p<0.01 (both at 6 hr and at 14 hr, AMPA vs. control, Student's t-test). To calculate the period length, each middle point between peak and trough in the increasing phase was first determined, and the time at the middle point was subtracted by the time at the previous middle point. (E) PRC obtained with SCN slice cultures stimulated by AMPA application. The x axis represents the normalized time after the peak (1 normalized hour = free running period/24 hr). The y axis represents the magnitude of phase shifts normalized by multiplying each shift in hour by the factor of 24 hr/free-running period. Plus and minus values mean phase advances and delays, respectively. Each value is the Mean ± SEM. The data obtained from multiple SCN slices during two hours were averaged. Hours shown on the x axis represent the middle of each two hours interval. One-way ANOVA revealed significant differences in PRC amplitudes obtained by AMPA application, but not in that obtained by control application (see Materials and Method). Post-hoc analysis using Scheffe's multiple comparisons revealed that the magnitude of AMPA-induced phase shifts at 6 hr was significantly different from the magnitudes at all other time points except at 2 and 4 hr (p<0.01).

