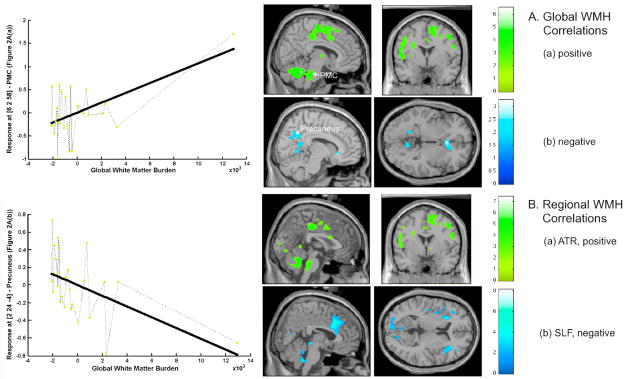
Figure 2. Images related to correlations.
A. Correlations between regional brain activity on fMRI and global WMH burden: (a) positive correlations (P < 0.01, uncorrected; r ≥ 0.46); upper left graph: correlations in PMC; (b) negative correlations (P < 0.05* uncorrected; r ≥ 0.34); lower left graph: correlations in Precuneus.
B. Correlations between regional brain activity on fMRI and WMH burden in selected white-matter tracts: (a) positive correlations with ATR burden (P < 0.01 uncorrected; r ≥ 0.46); (b) negative correlations with SLF burden (P < 0.05* uncorrected; r ≥ 0.34). *threshold chosen for image display only.

