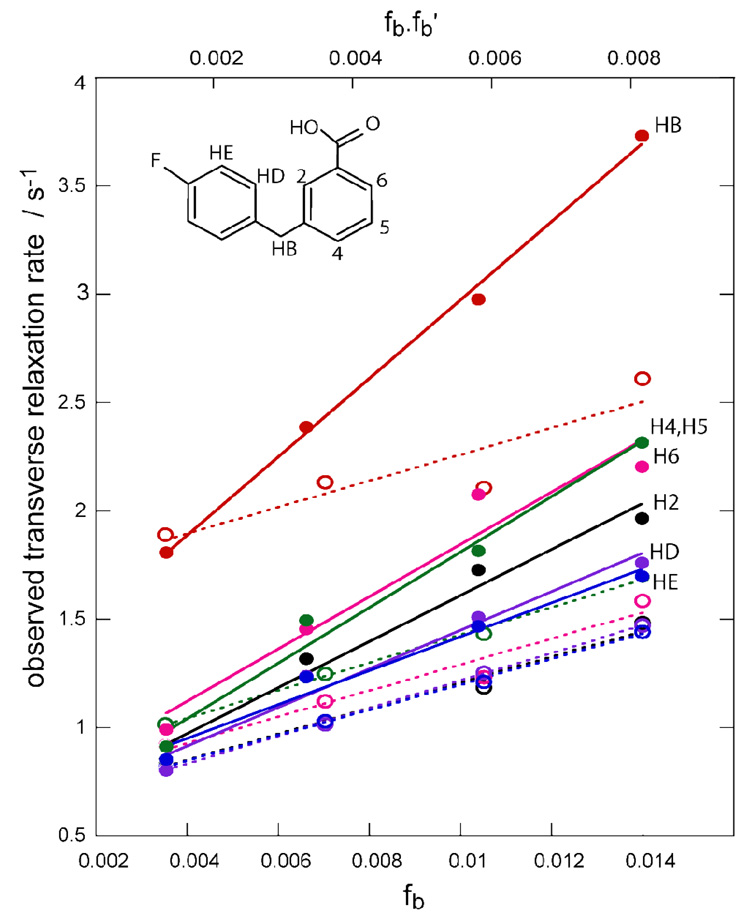
Figure 2.
Plot of relaxation rates of 300µM 3p-FB (shown inset) with Fe(env5.0)3 and unlabeled or MTSL-labeled C29-e5.0 in ratios of 3:3, 6:6, 9:9, 12:12 µM. Relaxation rates in the diamagnetic sample are plotted against fb (open symbols and dashed lines); relaxation rates in the paramagnetic sample are plotted against fb·fb’ (closed symbols, solid lines). Experiments were conducted at 500MHz. Protons H4 and H5 are overlapping.

