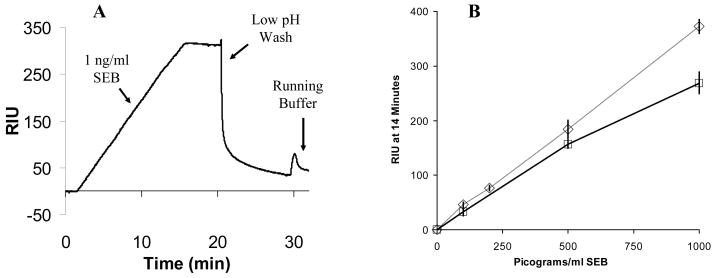
Figure 7.
(A) SPR sensorgram showing a low pH wash to rapidly reset the sensor surface following a 1 ng/mL SEB detection in stool. (B) SEB detection in stool samples with zero (◇- ◇) and one (□- □) regeneration of the surface demonstrating the functional regeneration of the sensor surface following SEB detection from the complex (stool) sample. The data for “zero” regeneration are the same as the stool detection data shown in Figure 5 and are shown for comparative purposes. Results for one regeneration at 100 (33±7.4 RIU), 500 (156±7.1 RIU), and 1000 (269±19.8 RIU) pg/mL are shown. The control value (unspiked sample) was 15.5 RIU, and was subtracted from the data shown.

