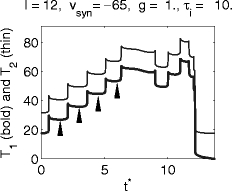
Fig. 6.

Graphs of T 1 and T 2, the delays between the arrival time t ∗ of the inhibitory pulse and the first and second spikes following it, respectively, for the classical Hodgkin–Huxley model with shunting inhibition. (Arrows indicate values of t ∗ for which trajectories and voltage traces are plotted in Figs. 7 and 8)
