
Table 5. Individual end points of the composite outcome in Hp 2-2 and non-Hp 2-2 diabetes mellitus individuals randomized to vitamin E or placebo in the three trials: stroke.
| Study | Vitamin E |
Placebo |
Weight (%) |
Odds ratio (IV, fixed effect, 95% CI) | |||
|---|---|---|---|---|---|---|---|
| Events | Total | Events | Total | ||||
| Hp 2-2 | |||||||
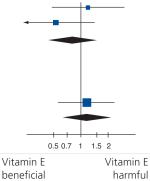
| HOPE | 12 | 222 | 8 | 177 | 43.3 | 1.21 (0.48–3.02) |
|
| ICARE | 6 | 726 | 11 | 708 | 56.7 | 0.53 (0.19–1.44) | |
| Subtotal (95% CI) |
948 | 885 | 100 | 0.82 (0.42–1.59) | |||
| Total events | 18 | 19 | |||||
| Non-Hp 2-2 | |||||||
| HOPE | 16 | 326 | 15 | 353 | 100 | 1.16 (0.57–2.39) | |
| Subtotal (95% CI) |
326 | 353 | 100 | 1.16 (0.57–2.39) | |||
| Total events | 16 | 15 | |||||
There was a nonsignificant reduction in stroke in Hp 2-2 individuals with vitamin E, odds ratio: 0.82; 95% CI: 0.42–1.59; p = 0.56. There was a trend towards increased stroke with vitamin E in non-Hp 2-2 individuals, odds ratio: 1.16; 95% CI: 0.51–2.39; p = 0.68.
HOPE: Heart Outcomes Prevention Evaluation; Hp: Haptoglobin; ICARE: Israel Cardiovascular Events Reduction with vitamin E; IV: Inverse variance.