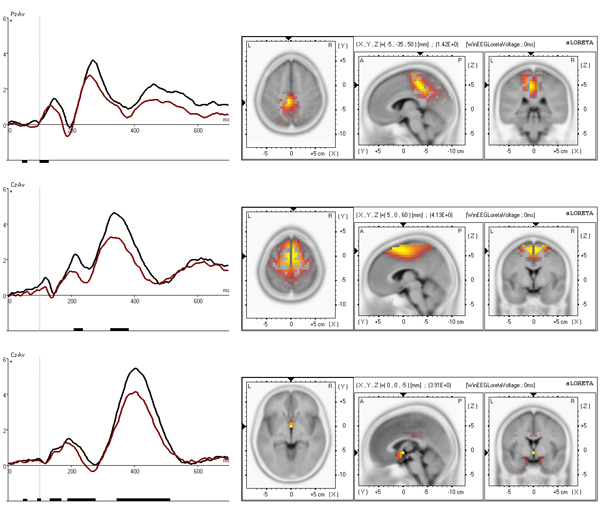
Figure 4.
Executive independent components Top: BA 5 component at Pz. Middle: BA 6 component at Cz. Bottom: BA 25 component at Cz. Time courses (left) are presented separately for control (black) and ADHD (red) group. x axis is time in ms, y axis is amplitude in μV. Results of t-statistics are presented below the curves with vertical bars corresponding to p<0.05. SLORETA imaging is presented on the right.

