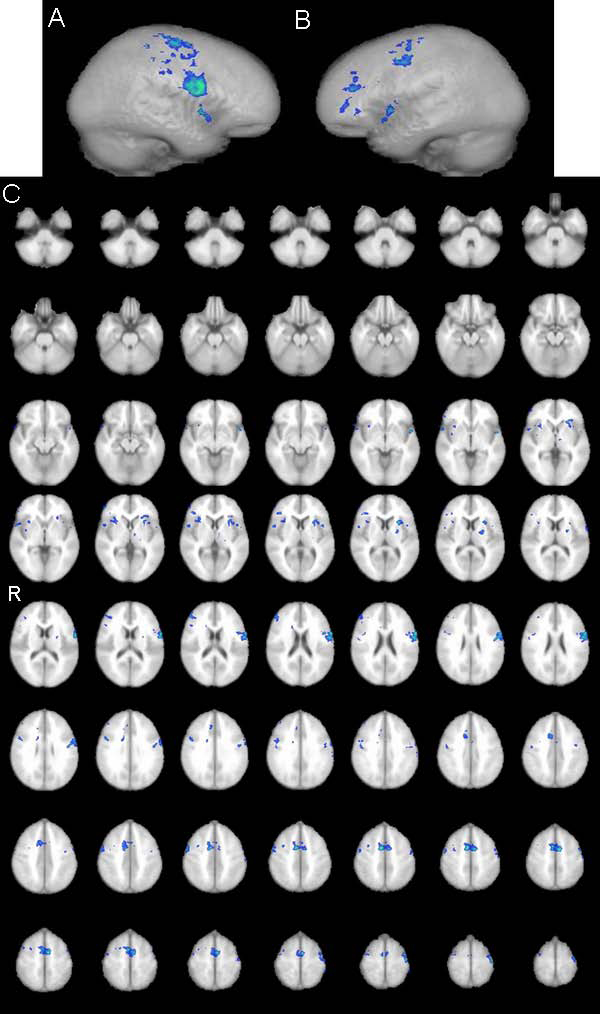
Figure 2.

fMRI male group analysis fMRI map activation patterns in the group of male subjects: A) in the left hemisphere; B) in the right hemisphere; C) in transversal projections through the whole brain (cluster threshold activation images (min. blue, max green) Z statistic range automatically calculated by default (1.7< Z< 3.4))
