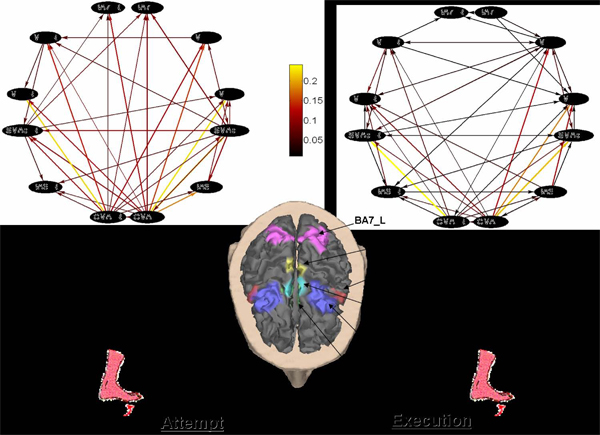
Figure 4.
a) Average in- and out-degrees for the SCI group in the Beta frequency band. b) Average in- and out-degrees for the CTRL group in the Beta frequency band. c) Average in- and out-degree distributions for the SCI group in the Beta frequency band. d) Average in- and out-degrees distributions for the CTRL group in the Beta frequency band.

