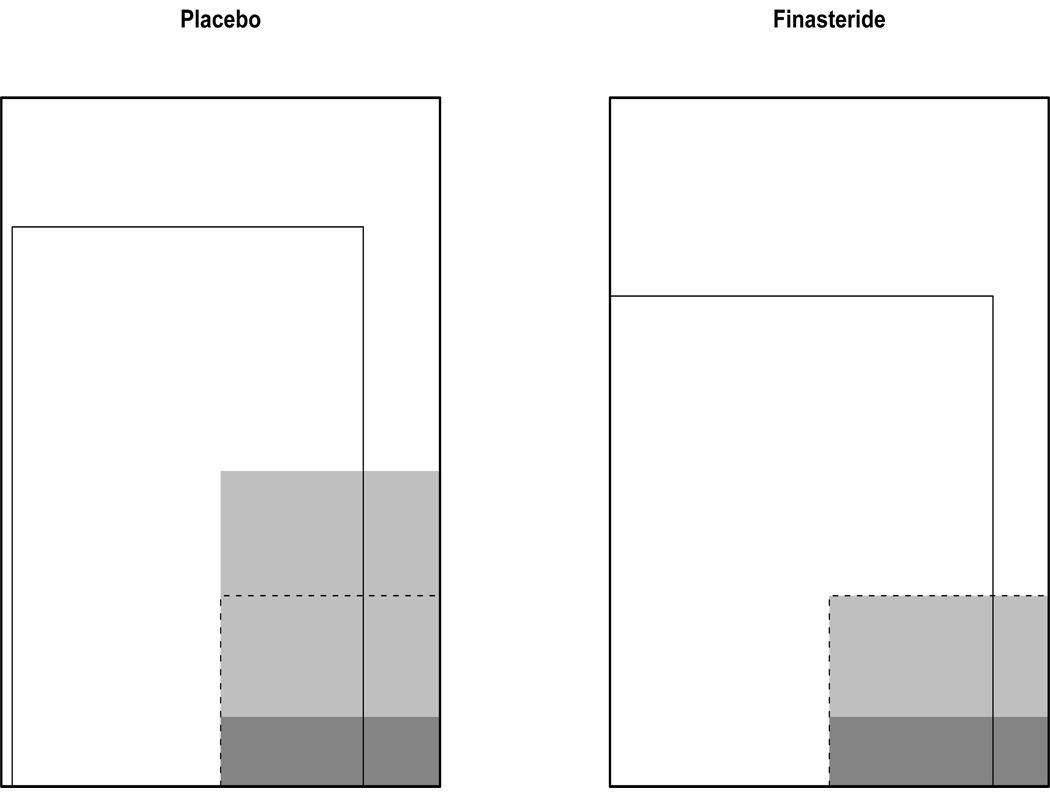
Figure 1.
Hypothetical example of the impact of post-randomization selection in the PCPT analysis. Because of randomization, men in the placebo and finasteride arms are comparable. The shaded regions are those men who developed prostate cancer, the darker shade corresponds to those who developed high-grade cancer. The solid inner boxes in both arms designate those men whose cancer status was determined by biopsy. Notice that the overall proportion of men who develop high-grade cancer is identical between treatment groups. However, the proportion of high-grade cancers among those diagnosed with cancer is much higher in the finasteride arm. The dashed box corresponds to those men who would have gotten cancer regardless of their treatment assignment; a comparison of cancer grade among men in this subpopulation allows one to assess the effect of finasteride on cancer severity.

