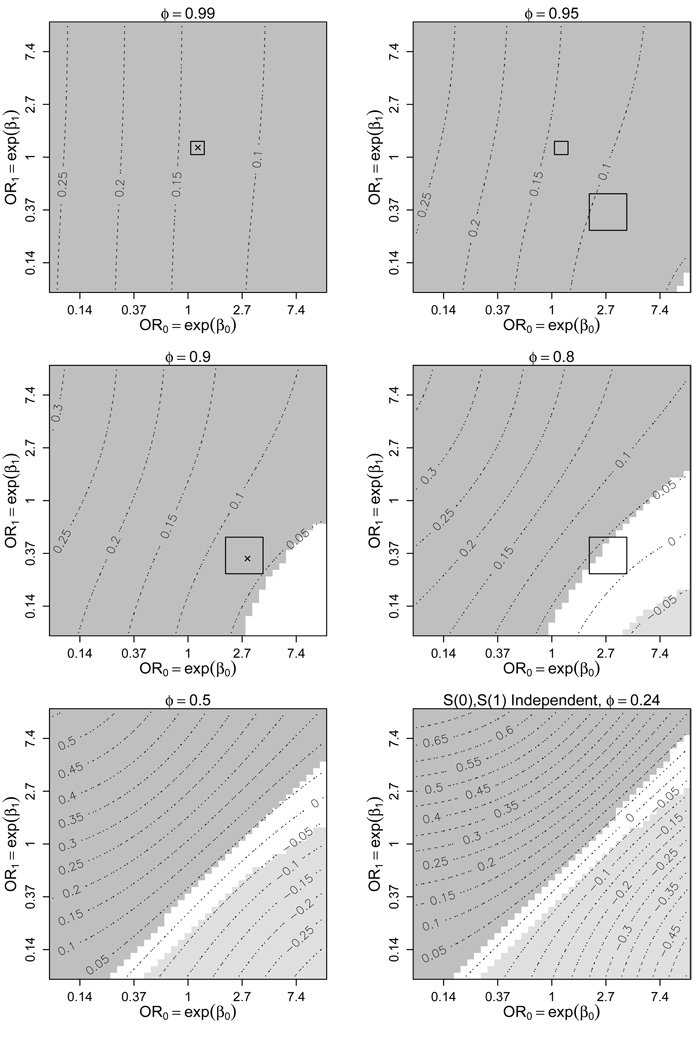
Figure 3.
Contour plots of for varying levels of the sensitivity parameters β0, β1, and ϕ under (1), (2), (3), and (6)–(8). ϕ is the probability of prostate cancer if randomized to placebo given prostate cancer in the finasteride arm. OR0 (OR1) is the odds ratio for prostate cancer in finasteride (placebo) based on cancer grade, given cancer in placebo (finasteride). The shaded regions represent those choices of β0, β1, and ϕ where H0 : ACE = 0 is rejected at the 0.05-level. The darker (lighter) shades are where ACE > 0 (ACE < 0), implying a higher (lower) risk of high-grade prostate cancer on finasteride. The rectangles represent ranges of our sensitivity parameters selected by two subject matter experts. The × represent their most likely sensitivity parameter values.

