
Figure 4.
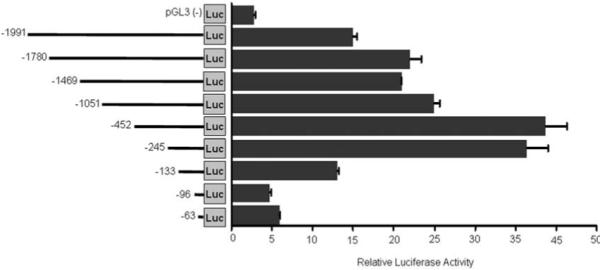
Identification of promoter sequences in FAP gene. Control pGL3 luciferase constructs or pGL3 contains various regions of FAP 5′ flank regions indicated in the graph were transiently co-transfected with Renilla control into HOS cells and luciferase activity was measured 48 hrs after transfection. The ratio of luciferase activity versus renilla control is shown in the graph. Values are mean +/− SE representing at least three independent experiments. The constructs are numbered on the left relative to the initiate ATG.